Open GIS Academy

Get GIS Certification Today

2 months instructor led course curated with real world practical applications of GIS to solve community challenges and accredited to the world recognised level.

Read more
kyambogo_university_training

Youth Mappers

Uganda Chapters

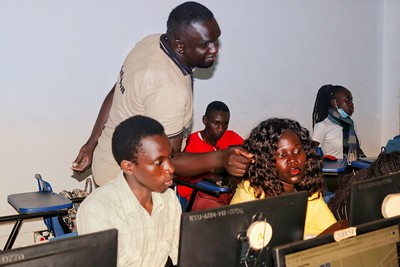
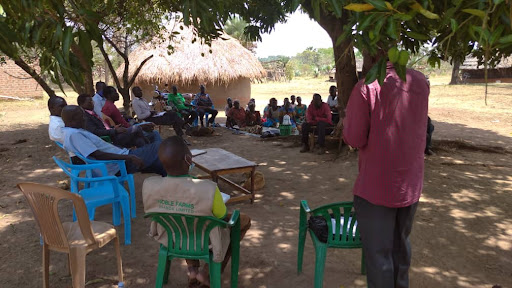
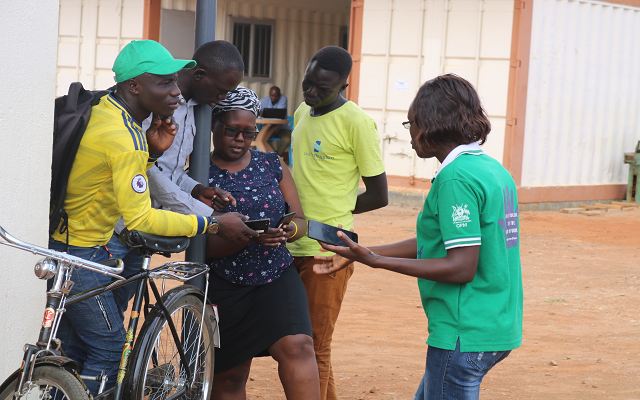
Exposure and skills development as we support our communities to solve challanges is attained by support of University students who volunteer to map their communities.

Read more
kyambogo_university_training

Disaster Response

Local Disasters

OpenStreetMap Uganda works together with district disaster management committees, Office of the Prime Minister among others to support on geospatial assessment for risk accessment.

Read more
kisoro_disaster_response

Drone Technology

Staff Capacity Growth

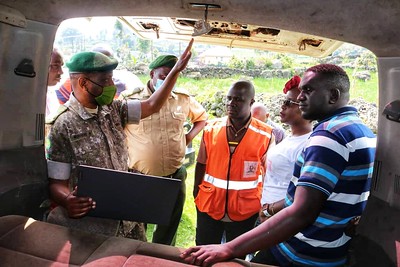
Our gets to learn more about drone flights for disaster response and preparedness.

Read more
Drone Training to Capacity Staff

What We Do?

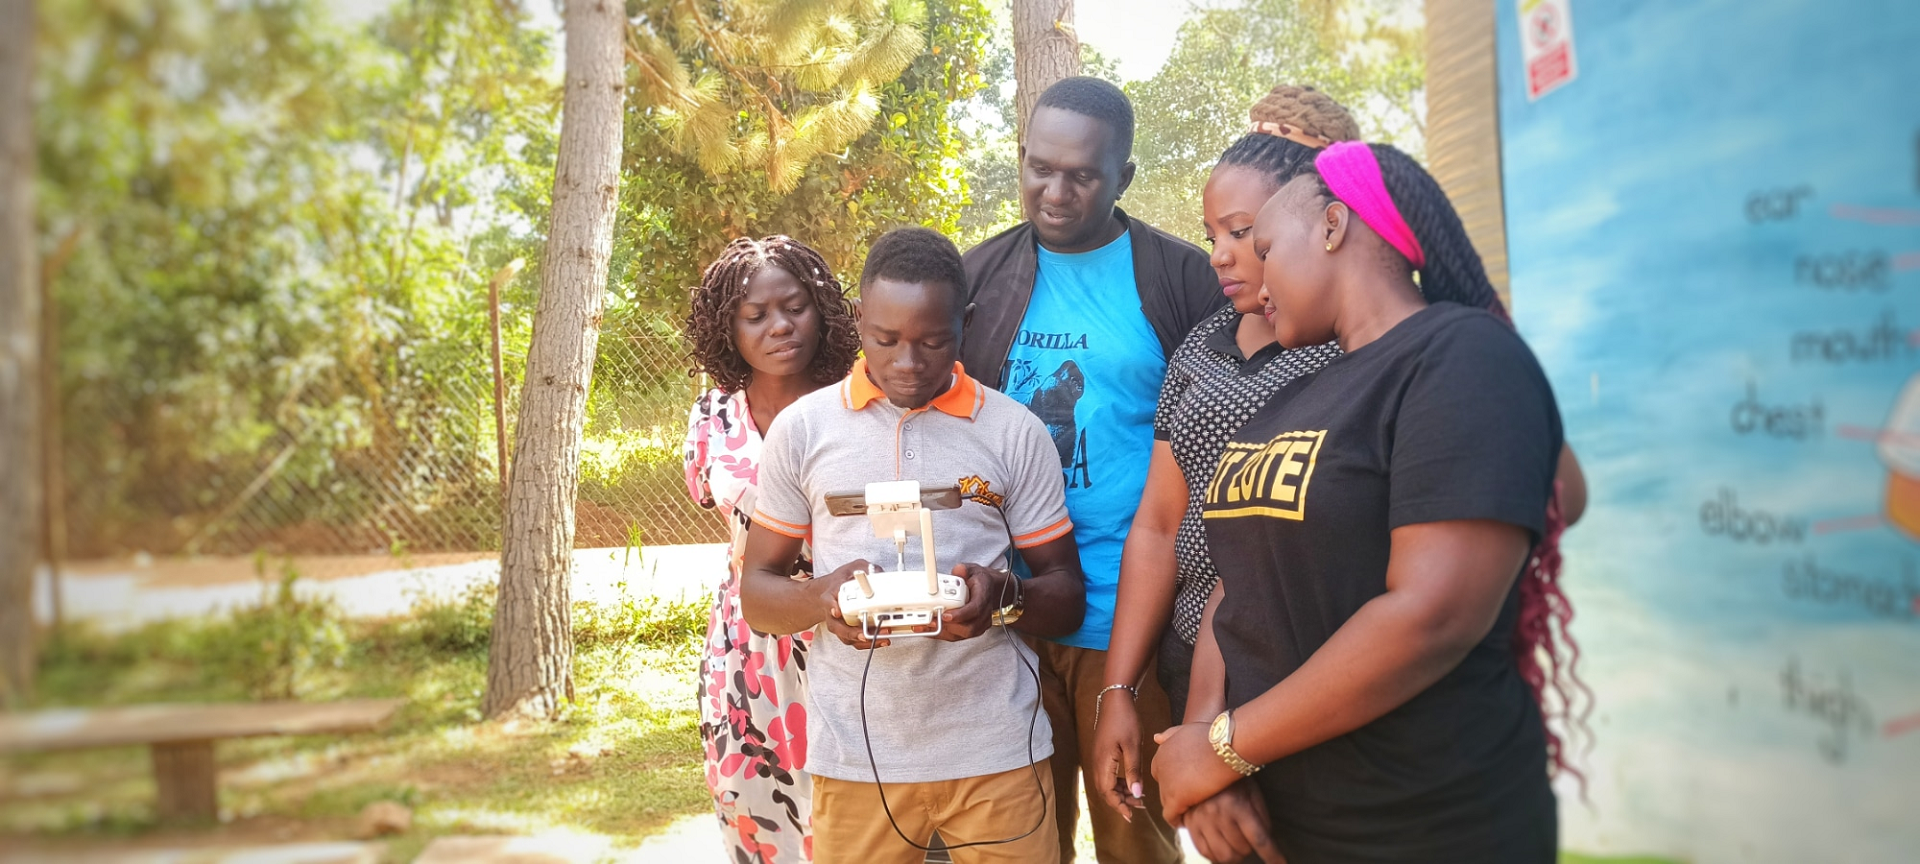
Open source tools and Open data are leveraged to support our work with limited resources available to provide standard and quality work. We work with a community model approach to provide opportunities to the local talent.

Disaster Response Uganda

Disaster Response

We provide geospatial support in times of disasters through imapct assessment for informed decission making by response agencies.

Geospatial Data Visualization

Geospatial Data Visualization

Project reporting, monitoring and evaluation for fundraizing, impact assessment is key. We provide this service with the application of GIS and open source tools.

Mobile Data Collection in Uganda

Data Collection

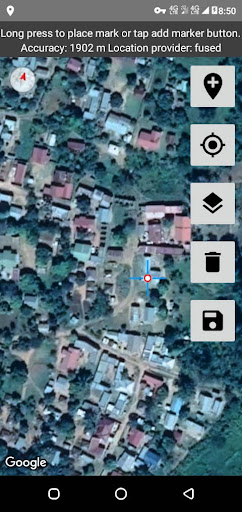
We deploy mobile data collection techniques in different contexts that support research in regards to data collection using open source tools such as Open Data kit, Kobotoolbox, among others.

Have you seen our works?

Explore below our works in contexts of refugees, hosting communities, health industry, sustainable cities, financial inclusion, disaster preparedness and response, humanitarian response support, tourism exploration, monitoring and evaluation.

Bundibugyo STOPSPILLOVER

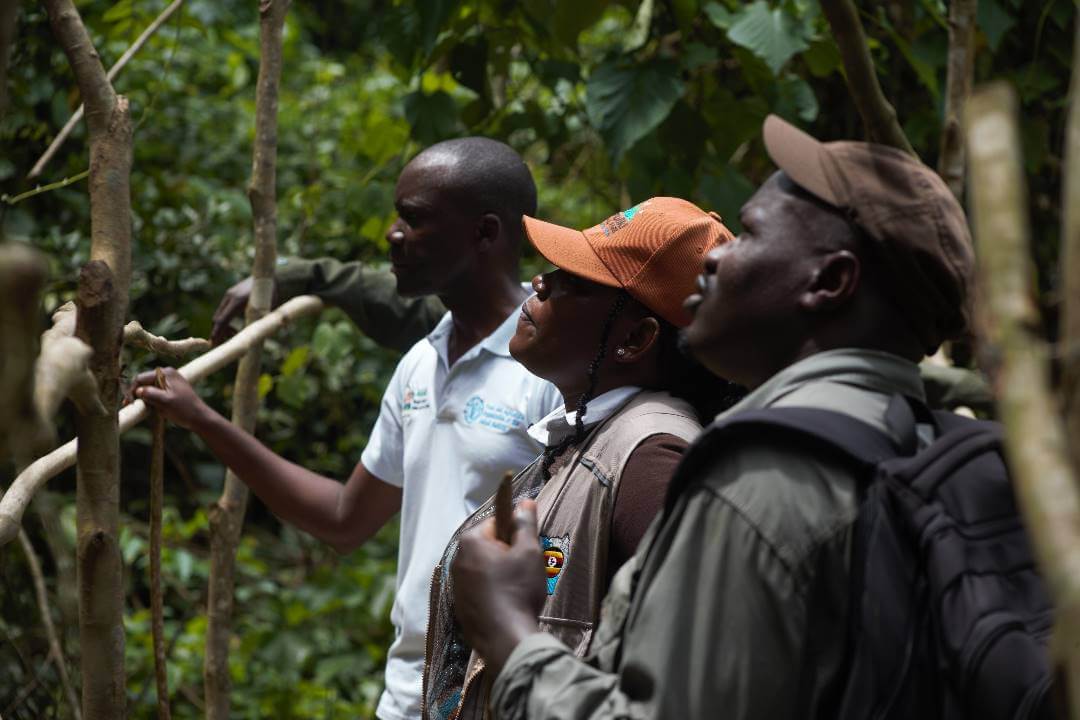
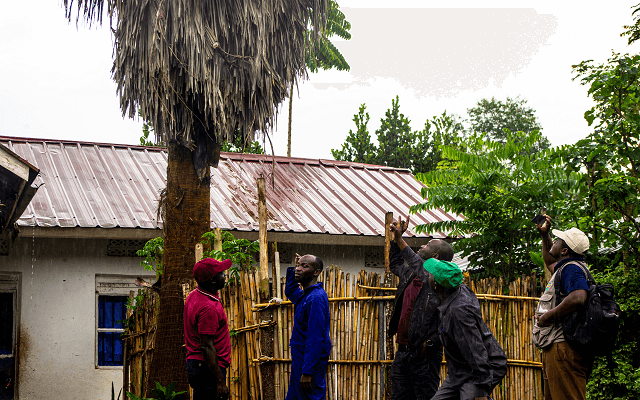
Bat roasts mapping in Semuliki National Park.

Community Participatory Mapping Bundidbugyo District

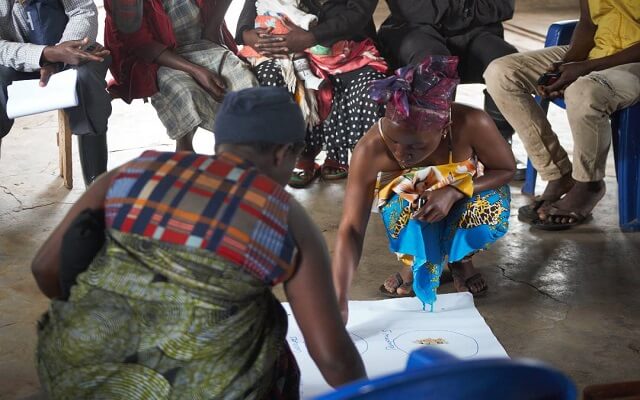
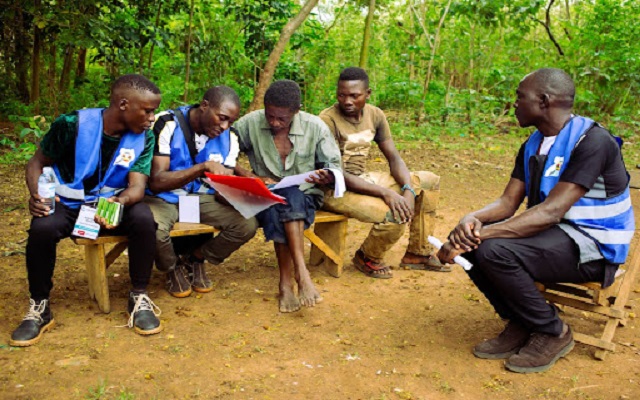
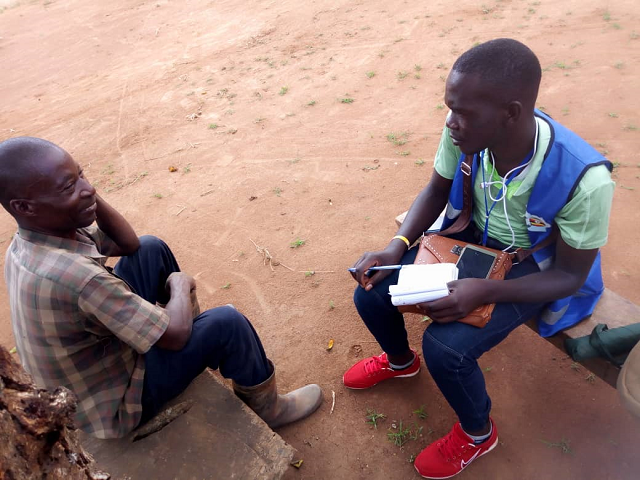
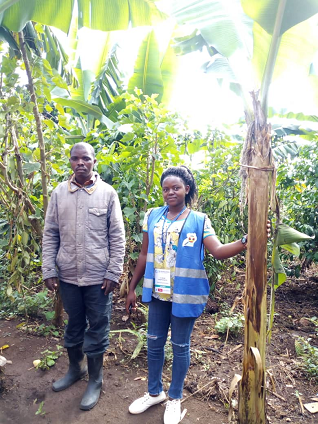
Community participatory mapping in Bundibugyo District.

Data Enumerators Training Bundibugyo District

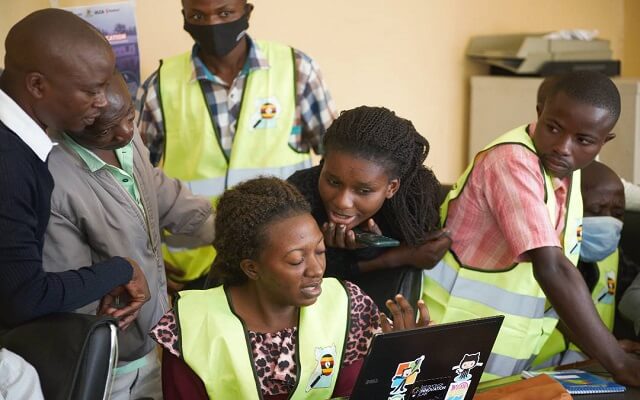
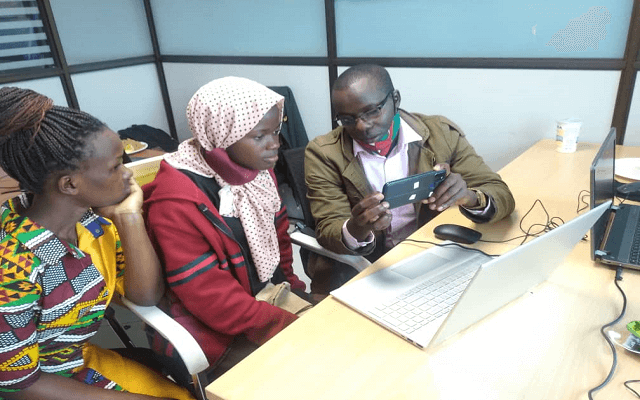
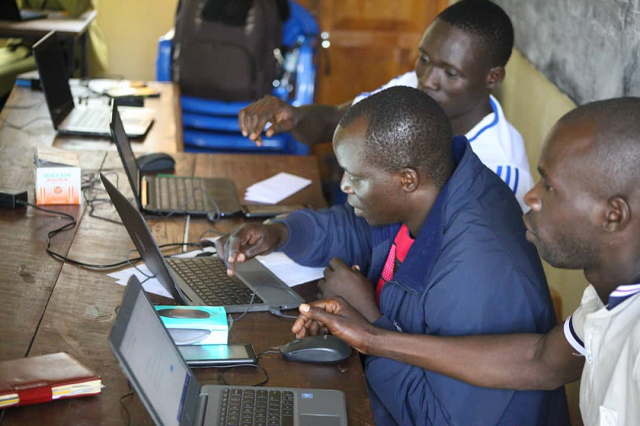
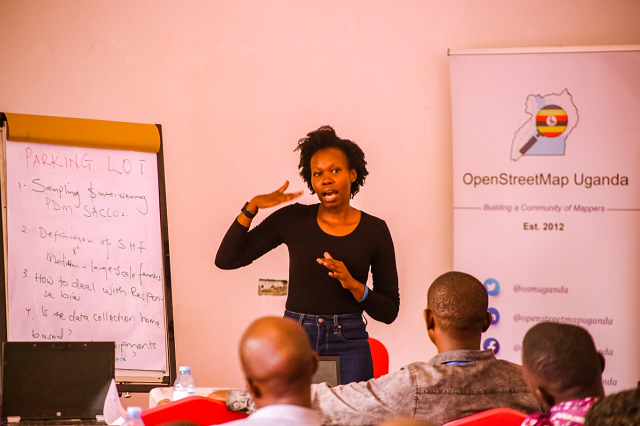
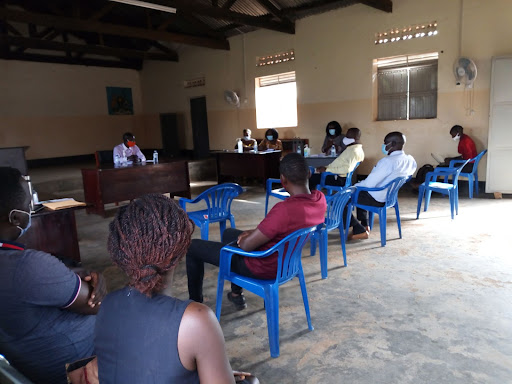
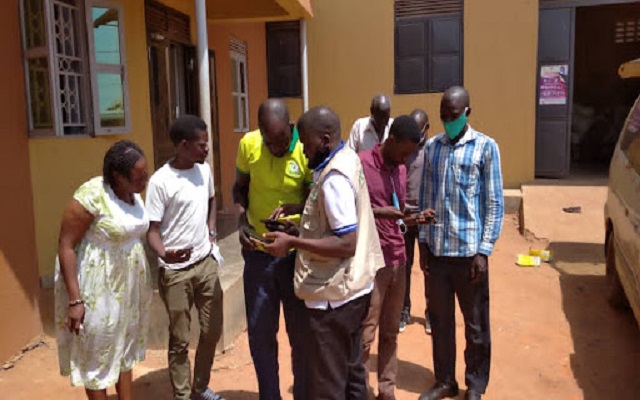
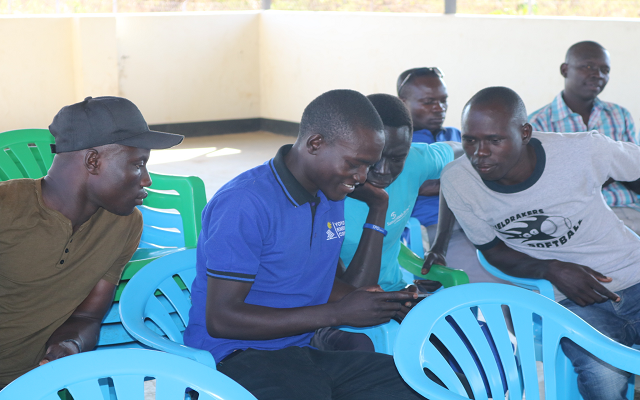
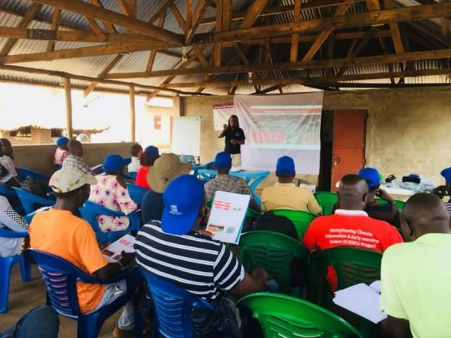
Enumerators capacity growth training in Bundibugyo district on mobile data collection.

STOPSPILLOVER Data Collection

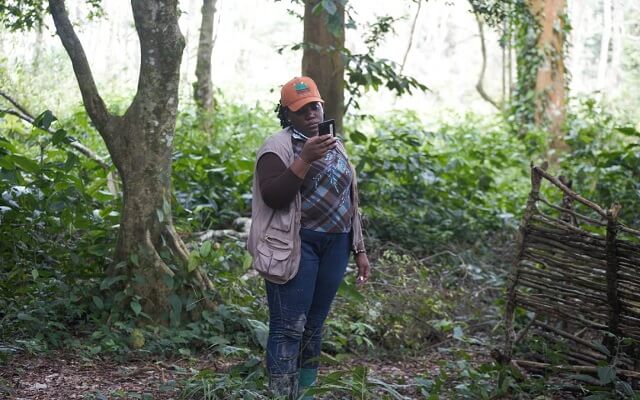
Data collection in Semuliki National Park.

BAT

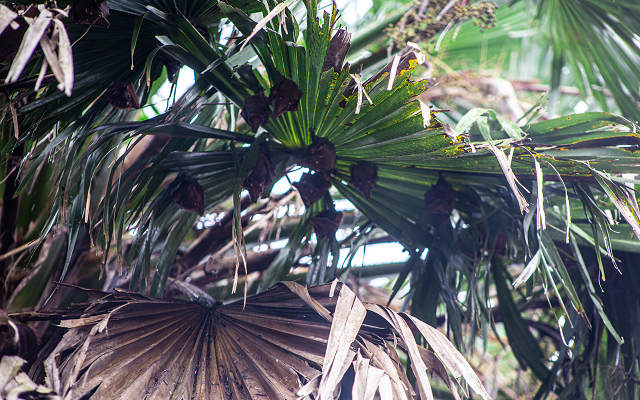
Bat roast in a palm tree.

STOP SpillOver, Uganda

Project Period: August - December 2022
Location:Bundibugyo District, Uganda

Project Description

HOT is part of the global consortium STOP Spill over that is engaging local and national partners across multiple countries to develop initiatives that can contribute to cartelling the likelihood of zoonotic diseases spreading from animals to human beings.

In Uganda, the STOPS team is working in and around communities close to National game parks and reserves especially in the district of Bundibugyo. With the Semuliki National Park in the North and Rwenzori National Park in the South, Bundibugyo district is built between two very biopic national parks with a variety of wildlife moving across. The Population and economic activity within the district is also on the rise with over 80% of the population relying on agriculture to have an income.This brings about an increase in wildlife and human interactions especially in the rural settings of the district.

For this project, OSM Uganda (Sub-Contracted by HOT) was to support the consortium to understand the spatial interactions between bats and humans in the hot spot targets. This involved mapping all major human infrastructure interactions like schools, health centers, playgrounds, gardens, caves, tourist sites, roads, offices and homes. Major bat nesting areas in and around the interaction sites was also mapped under this project with the guidance and support of the STOPS country Team.

The data collected was then used to create map products that will assist the STOPS team have an informed understanding of the human and bat interaction in the 3 Sub Counties of Bundibugyo district.

Actual Works

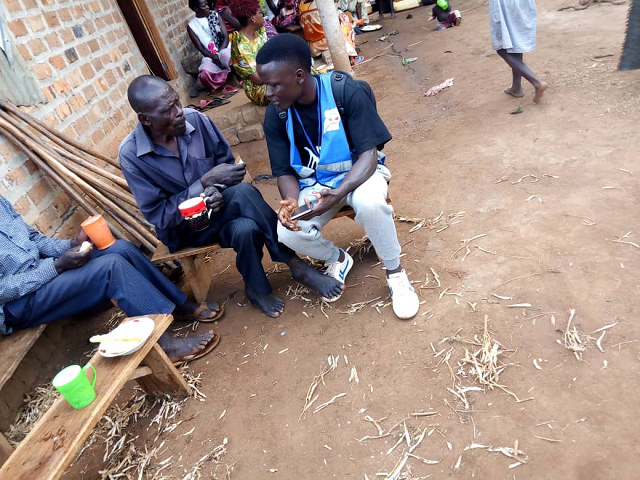
Under this assignment, OpenStreetMap Uganda, subcontracted by HOT, worked on the data collection and validation exercise of infrastructure in Bundibugyo district. This included collection of all human infrastructure interaction interfaces (point of interest including schools, health facilities, agricultural gardens, businesses etc) with Bats in the 3 hotspot sub-counties (Harugale, Ntandi TC, Burundo) in Bundibugyo district.

OSM Uganda further mapped the other 17 sub-counties to provide up-to-date maps to the communities of Bundibugyo district and its leadership to support informed planning decisions for the district.

Furthermore,

  • On completion of data cleaning, data was uploaded to the OpenStreetMap platform.

  • Development and approval of a bat interface data collection tool.

  • Information map products were shared through the creation and sharing of draft information map products (Interactive and static maps) with HOT, District administration (Sub County, RDC, CAO, LC 5 Chairperson’s offices) and STOPS consortium.

OSM in Schools Kisoro District #ADAI
Kisoro Progressive Senior School students in a digital learning session.
Africa Digital Access Initiative
Kisoro Progressive Senior School students in a digital learning session.
Teachers Openmapping skilling
Teachers in Maracha District during a digital learning session.
ADAI_OSM in Schools
Geospatial Mapping Platform ( OpenStreetMap).

OpenStreetMap in Schools Program

Donor: Humanitarian OpenStreetMap Team (Opening Mapping Hub - Eastern & Southern Africa)
Project Period: May 2022 - May 2023
Location:- West Nile and Kigezi Region, Uganda

Project Description

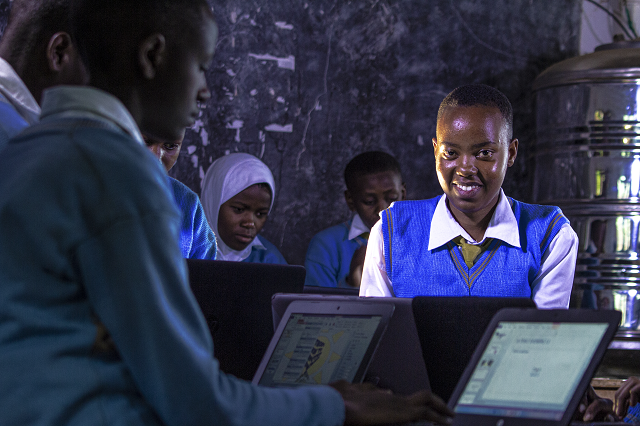
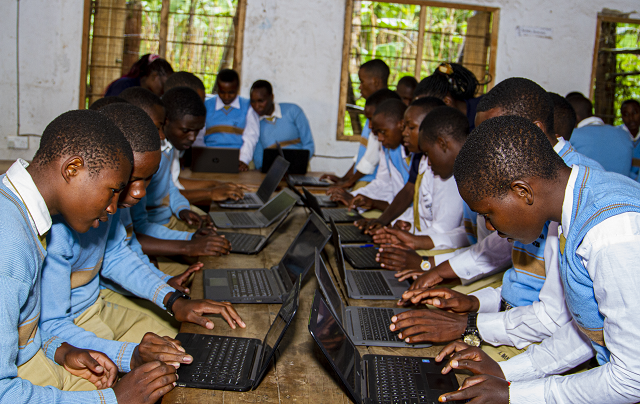
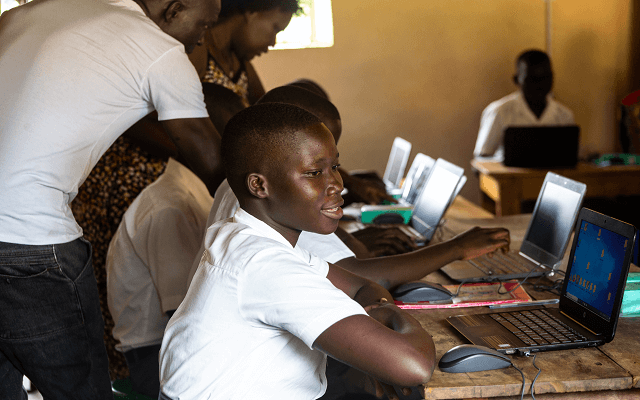
Uganda has a high youth population. Digital literacy has become an essential skill for young people to possess in today's society. However, many students in rural areas of Uganda lack access to the necessary tools and resources to develop their digital skills. This is where OpenStreetMap Uganda's proposed project comes in, aimed at promoting digital literacy in Uganda through geospatial mapping and leveraging the existing pool of PC-Laptops.

The project aimed to address the lack of access to ICT tools and resources which is a primary challenge in fostering quality education, especially in rural areas. The project aimed to address this challenge by providing ICT tools and learning materials to schools through a shared basis model combined with applying geospatial learning techniques.

The activities to achieve the project objectives included:-

  • Leveraging the OpenStreetMap Uganda’s existing ICT tools (PC-Laptops)
  • The development of learning materials on geospatial mapping and digital literacy
  • The training of teachers and students on the use of ICT tools and geospatial mapping.
  • The conduction of workshops on the use of geospatial mapping for community development and empowerment.
The project was implemented in partnership with schools in different regions of Uganda to provide access to ICT resources and training that will enable students to develop their digital skills.

Students and teachers contributed geospatial data via the OSM platform that included; schools, roads, buildings among others were added on the map. This data that the project generated is being used in different ways by:
  • The local governments and authorities use the collected geospatial data to improve their urban planning and management.
  • The schools and universities use the data to enhance their research and educational activities.
  • Partners like MySchool Today, are using the geospatial data to update the global schools map.
  • The students and teachers use the geospatial data to further their personal and professional development.
The OSM in School project is a component of the Africa Digital Access Initiative which is an on going program. For further details and updates please visit the program webiste here https://adailabz.com

Blogs
Data Collection with Farmers on World Bank Research
OpenStreetMap Uganda's Enuemrator (Mr. Asaba Valence) interacting with a Farmer in Apac District.
Enumerators with Chris Browne for Farmer's survery field testing on world bank research
Enumerators with Chris Browne from E4I - Mercy Corp for Farmer's survery field testing.
Farmers Survey on World Bank Research
OpenStreetMap Uganda's Enuemrator interacting with a Farmer in Nakasongola District.
Farmer's survey on world bank research
Ms. Alinda Kagadi with a farmer at his farm in Hoima District.
Mercy Rose from E4I training enumerators on the Field survey etiquete
Mercy Rose from E4I-Mercy Corp training enumerators on the Field survey etiquete.

Estimation of Electriity demand in the Agriculture Sector.

Client:The World Bank
Project Period: May 2022 - Ongoing
Location: 25 Districts in Uganda
Link:

Project Description

Reliable demand estimation is a key parameter to electrification planning as well as the prioritization and design of access programs to promote the productive use of energy (Banerjee et al, 2017). Demand estimation analytics can help scale up the efforts to stimulate the productive use of electricity in the agriculture sector. Prioritizing electrification by considering areas with existing or potentially high levels of agricultural production and related energy demand may help,

  • Improve the financial viability of access expansion through higher revenues for the utility.
  • Deliver greater economic benefits from electrification to rural areas.
The global knowledge and evidence generated by this agricultural demand estimation and modeling exercise could be then used to replicate successful approaches throughout the World Bank energy access portfolio, and the findings from the work will be disseminated to further global knowledge and encourage further studies or activities in this area. Uganda as of the countries for the pilot has been identified as it has opportunities for large-scale electricity demand interventions.

The agricultural sector employs over 72% of the workforce; the potential for value addition and mechanization of Uganda’s agricultural sector is low. For instance, more than 95% of farmers rely on human power for their farming activities (UBOS) and less than 1% of the land is irrigated (WB, 2013). Evidence suggests energy in agriculture increases farmers’ yield and income. For instance, 47 maize shellers in the Busoga region in Uganda doubled local farmers’ incomes in 3 years. Providing electricity to farmers that grow coffee, maize and beans, resulting in an annual income increase of 50% based on a cost-benefit analysis for Kapchorwa, in rural eastern Uganda.
This study aims to
  • Estimate electricity demand from the agriculture sector including irrigation and agro-processing.
  • Assess the opportunities and challenges to realize the potential electricity demand from the agriculture sector in Uganda.
For the national electricity demand estimation from agriculture activities, the approach would leverage various geospatial data as well as the data through the survey approach. In addition, the project will utilize an existing World Bank operation in Uganda – Agriculture Cluster Development Project (ACDP)(P145037). ACDP project supports activities and investments (termed as ‘matching grants’) designed to raise both productivity and overall production of five priority crops - maize, beans, cassava, rice, and coffee in 12 selected high-potential agricultural areas in Uganda termed “clusters.”

Project Objectives

The objectives of this project consist of two pillars.
  • First, this assignment aims to provide electricity demand estimates from the agriculture sector including agro-processing and irrigation in Uganda through survey data on the ground and geospatial data gathered.

  • The second goal of this assignment is to provide the recommended solutions to scale up and electrify the agriculture sector based on the assessment of the opportunities and challenges on the ground. The solutions on how to tackle those obstacles shall be also presented in the final output.


  • Agro Processors Mapping on World Bank Research
    Agro Processors Mapping.
    Findings and lessons from the project shall be disseminated among relevant stakeholders.

    The research project scope included surveys that is to cover 2,000 farmers, 200 Agro-processors, 75 Key informats, 75 Focus Group Discussions.

Uganda Tourism Dashboard
Uganda Tourism Guide:- Northern Uganda
Aruu Falls Campsite
Aruu Falls Campsite:- Northern Uganda
Aruu Falls
Aruu Falls:- Northern Uganda
Baker's Fort Patiko
Baker's Fort Patiko:- Northern Uganda

Mapping Tourist Eco Systems in Northern Uganda

Project Period:May 2022 - Ongoing
Location:Northern Uganda (44 Districts)
Web-Map:Tourism Guide

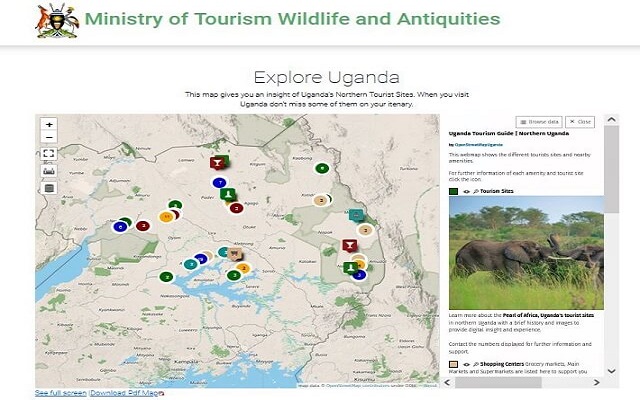
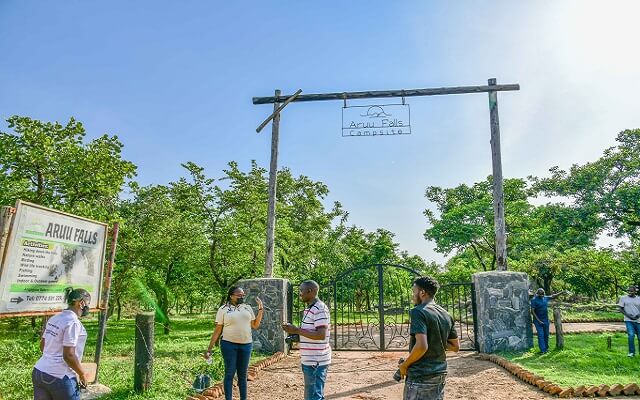
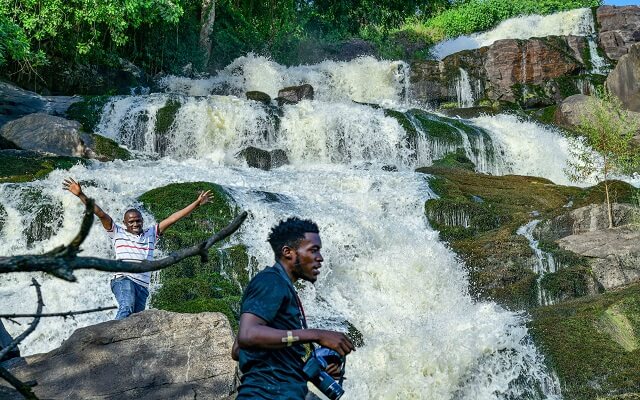
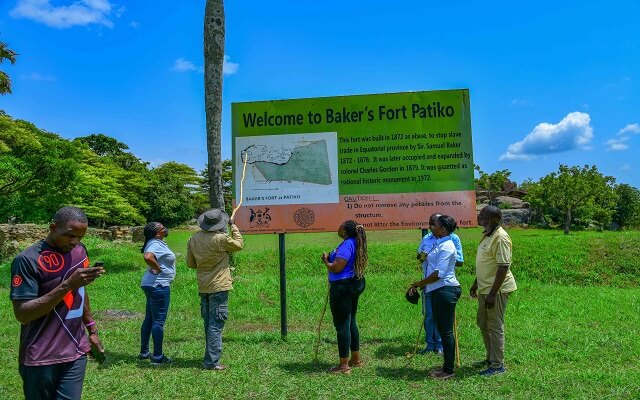
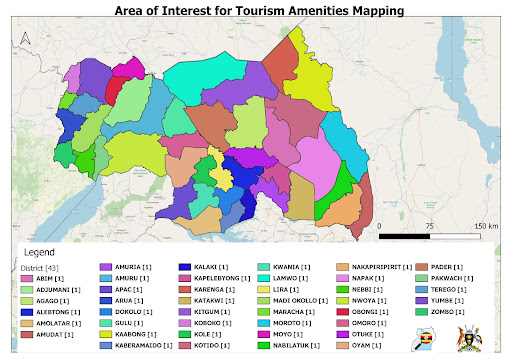
OpenStreetMap Uganda in collaboration with the Ministry of Tourism, Wildlife and Antiquities (MOTWA) worked on the development of Uganda Tourism Guide for northern Uganda. This included mapping of lodging facilities, and other vital service areas that affect the tourism sector such as Hotels, Banks, Shopping centres, tourism sites.
Mapping for Tourism

Scope of Tourism Mapping
The activities included:-
  • Remote mapping that adopted use of satelite data to trace buildings and roads with the use of OpenStreetMap platform.
  • Field data collection that was done collaboratively with MOTWA - Tourism developement officers and the OpenStreetMap Uganda's mapping supervisors utilizing open data collections tools.
  • Data analysis and map production. Data was processed for analysis and web development that resulted to the production of static pdf maps and interractive maps.
  • Web - portal embedding of interactive maps to the MOTWA website for public access.
Goal:
  • To collect information on significant tourism locations, lodging facilities, and other vital service areas that affect the tourism sector.
Outcomes:

Drainage Mapping
MapUganda Mapping Supervisors using RTK technology to map a drainage in Kinawataka, Kampala.
GNSS Calibration for Data Collection
OSM Uganda mapping team performing a GNSS Calibration for data collection on flooding.
Flood Mapping in Kampala
Mobile data collection using RTK technology.
Flood mapping in Kampala
OSM Uganda's Mapping supervisor Mr. Atibuni Innocent measuring the depth of a flooded drainage in Nalukolongo Drainage channel in Kampala.
Flood mapping in Kampala
Idenfication of points on the channel to be mapped
Flood mapping in Kampala
Bobby Russell - Project Manager (Stichting Deltares) working with stakeholders on a participatory mapping exercise in regard to flood mitigation in Kampala.

Technical support for the implementation of the Greater Kampala Integrated Flood Resilience Partnership

ClientStichting Deltares
Project PeriodApril - July 2022
LocationRubaga and Nakawa Divisions,Kampala City-Uganda
Link

Project Description

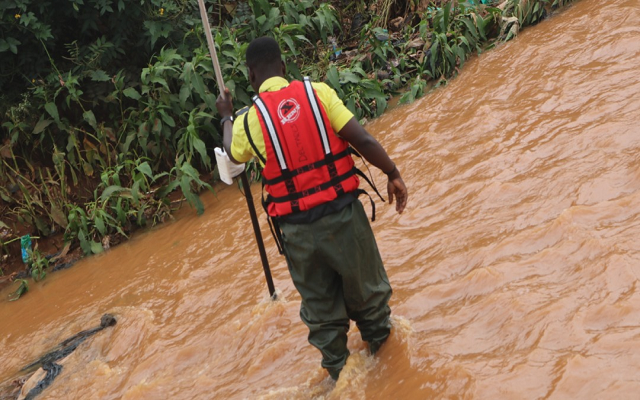
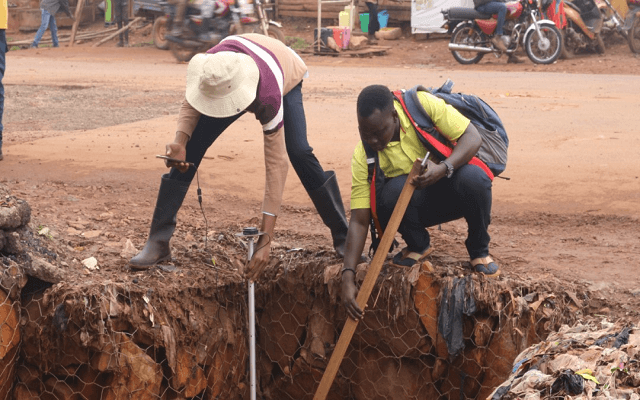
The Ugandan Ministry of Water and Environment (MWE) in collaboration with the private sector, civil society organizations, government agencies and other stakeholders with support from Deutsche Gesellschaft für Internationale Zusammenarbeit (GIZ) under the Natural Resources Stewardship Programme (NatuReS) are co-initiating and implementing the Greater Kampala Integrated Flood Resilience Partnership for flood resilience in the metropolitan area.

The overall objective of the Greater Kampala Integrated Flood Resilience Partnership is to promote investment in blue-green and innovative grey infrastructure, and inclusive solutions in up to two (2) sub/ micro -catchments in GKMA for improved urban resilience to flooding and enhanced socio-economic development in GKMA. Thus, specifically the partnership is aimed at:

  • Piloting sustainable blue-green infrastructure and innovative grey solutions to solid waste in drainage channels across specific locations to mitigate flooding, and safeguard jobs and investments.

  • Enhancing community and private sector engagement in flood control and stormwater management.

Flood mapping in Kampala
Stakeholders' engagement in understanding the sope of the flood mitigation zones for the project.

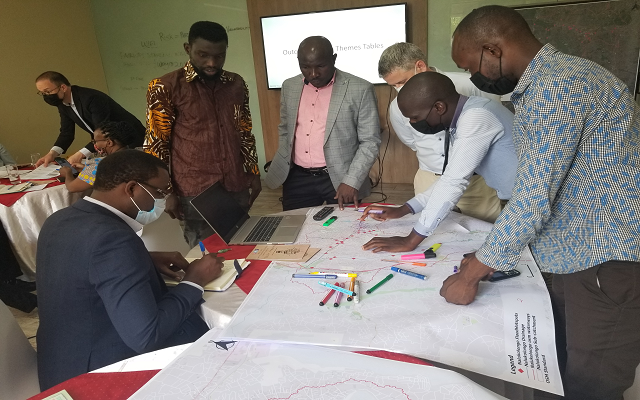
Overall, the partnership is intended to contribute to: Safeguarding jobs and investments through measurable reduction of damages caused by flooding within specific locations within GKMA; Strengthening the evidence base on optimization pathways to inform the integration of blue-green and innovative grey infrastructure solutions for flood resilience in an urban setting; Empowering communities for flood resilience through improved capacities of private, public, and civil society actors in mainstreaming and implementing flood resilience actions; Demonstrating collective and inclusive (private, public, and civil society) planning and investment in flood resilience and ensuring measurable reduction of solid waste in stormwater drainage channels within GKMA.

Actual Works

Under this assignment, OpenStreetMap Uganda developed a data collection platform ensuring that all cross-sections and drains had unique identifications. Mapped the drain cross-sections, the culvert/bridge dimensions and locations. The mapping consisted of recording the channel, culvert and bridge cross-sections where water should flow through using a high-accuracy global position system. For the channel cross-sections the mapped information included:
  • Ground/bed level position (XYZ) at approximately one meter increments along a linear transect perpendicular to the flow direction.

  • The transect (also called a cross-section), started at the top of the channel bank and proceeded to the top of the opposite bank.
manufacturer mapping
Mapping welding business.
manufacturer mapping
OpenStreetMap Uganda team visit to a Sanitizer and alcohol manufacturing plant in Kawempe, Kampala City.
manufacturer mapping
OpenStreetMap Uganda team visit to Uganda Industrial Research Institute (UIRI) in Namanve, Wakiso District.
Internet of Production Alliance
Manufacturers' Capabilities Dashboard

Manufacturer’s Capabilities Mapping

Project Period:April 2022
Location:Kampala City(Kampala Industrial Park and Kawempe Division) and Wakiso District (Namanve Industrial Park)

Project Description

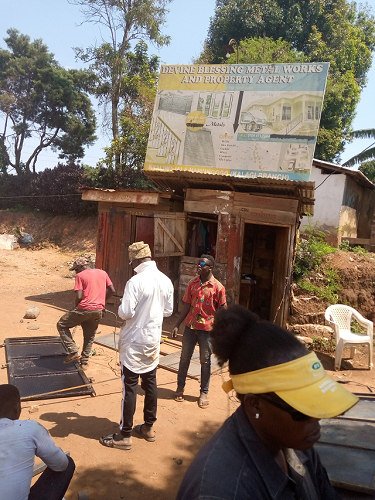
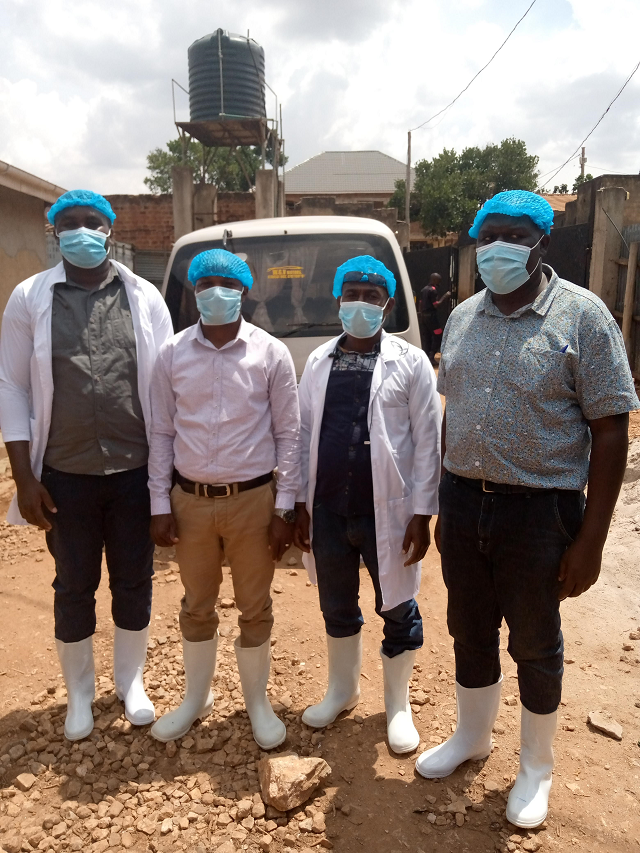
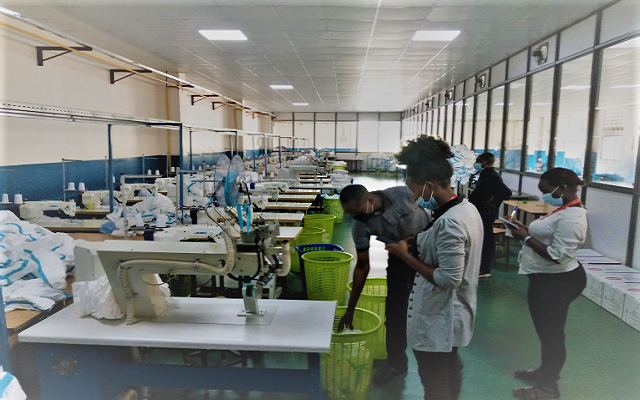
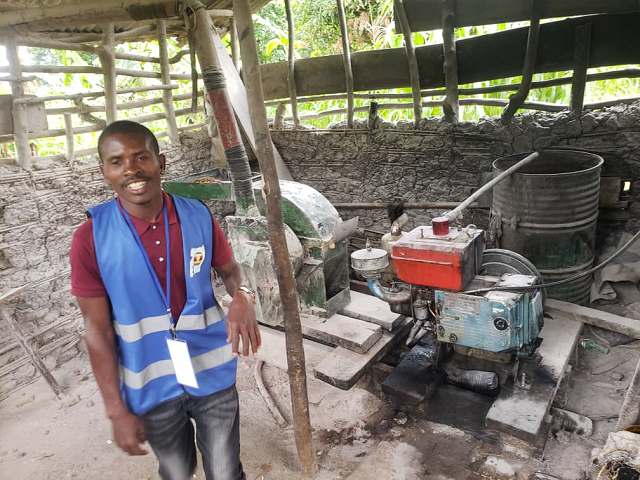
With the wide network of volunteers across Uganda, OpenStreetMap Uganda collaborated with Humanitarian OpenStreetMap Team and Field Ready (Supporting Frontliners for COVID-19 Response Project) on mapping manufacturers'capabilities to promote local manufacturing. The project focus was specific for production of PPEs. The team at OpenStreetMap Uganda proposed to map manufacturing capabilities in other sectors such as construction materials, agricultural machinery, and bottling companies. Mapping local manufacturing companies will help to further promote local purchase of locally manufactured goods, because people in Uganda and Africa at large companies tend to import goods from outside the country. This Award was to support continuation of the manufacturer’s capabilities mapping.

NYTIL mapping
OpenStreetMap Uganda team at NYTIL Industries industries in Jinja City.

Actual Works

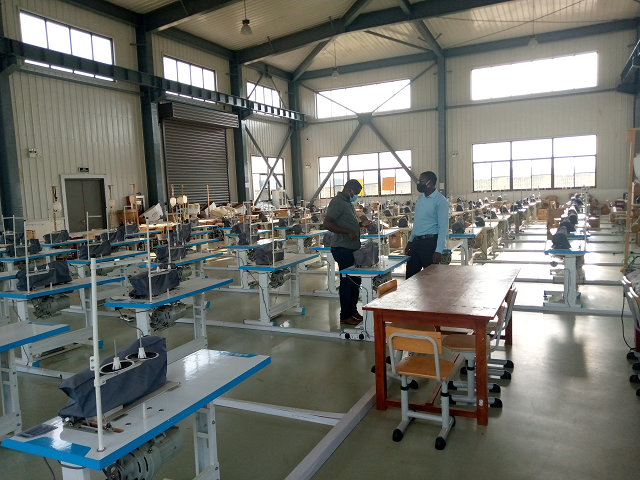
OpenStreetMap Uganda geospatially mapped manufacturers capabilities around Kampala industrial Area, Namanve Industrial Park and other areas around Kampala and Greater Kampala. During this data collection exercise we targeted large, medium and small scale manufacturing facilities in order to boost local manufacturing and supply. We were able to collect data from over 400 manufacturers.

The project aimed at mapping out different manufacturers to determine their capabilities based on their equipment, inputs and number of products produced per day. The data features included:-

  • The name, address and location of the manufacturing facility.

  • The products they manufacture and their daily production capacity.

  • The equipment and utilities to they use to determinea their manufacturing capacity.

  • The required inputs for the production process of the manufacturer.
somalia waste management mapping
Solid Waste mapping in Mogadishu using the HOT tasking manager platform
Mapathon
OSM Uganda Team remote mapping.

Remote Mapping for Solid Waste Management Project in Mogadishu

Partner:OpenStreetMap Somalia | HOT
Project Period:January - May 2022
Location:Mogadishu, Somalia
Link:Blog | Task Manager

Project Description

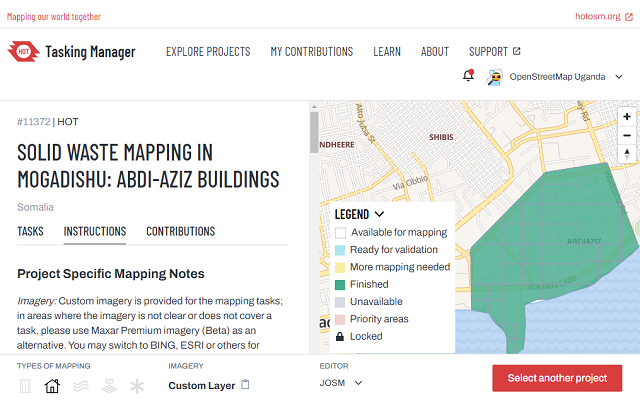
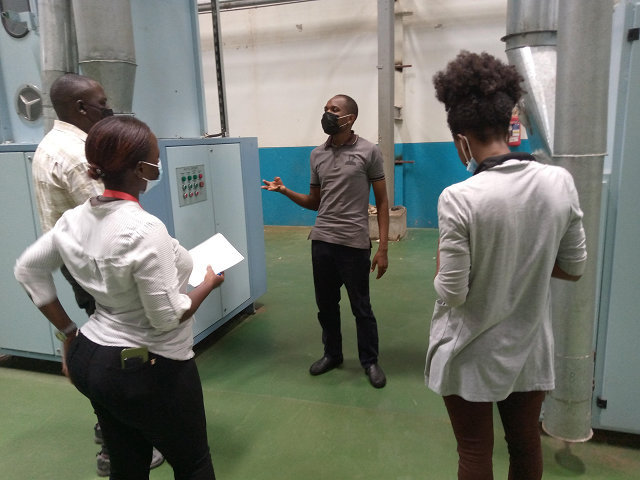
The project is a part of the Somalia Urban Resilience Project Phase II (SURP-II) program, supported by the World Bank and the Federal Government of Somalia.

Solid Waste Mapping in Mogadishu seeks to analyze the current Solid Waste Management systems in the city and identify key challenges and means to tackle them, and subsequently pilot activities to improve collection and disposal in project-supported areas. The main objective of this project is to build local capacity to develop accurate, up-to-date information and insights that can support real-time decision-making with regard to solid waste management.

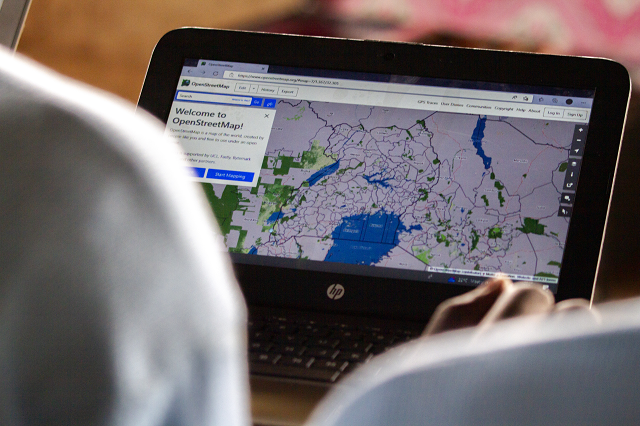
OpenStreetMap Uganda collaborated with OpenStreetMap Somalia to digitize the city's buildings, roads and other amenities of Mogadishu. Tools that included JOSM, HOTOSM Tasking Manager, Satellite Imagery were utilized on the project.

Cycle of Web Map Application Development
Northern Uganda Resilience Initiative Dashboard Overview
NURI Dashboard Overview
Food Forest overview of Northern Uganda Resilience Initiative program
Food Forest overview of NURI program.
Spring Protection overview of Northern Uganda Resilience Initiative Program
Spring Protection overview of NURI Program.

Geospatial MERL Dashboard and Atlas Development

Project Period:November 2021 - July 2023
Location:Arua, Rhino Camp, Nebbi, Koboko, Imvepi, Pakwach, Kitgum, Agago, Lamwo, Adjumani, Moyo, Obongi, and Zombo

Project Description

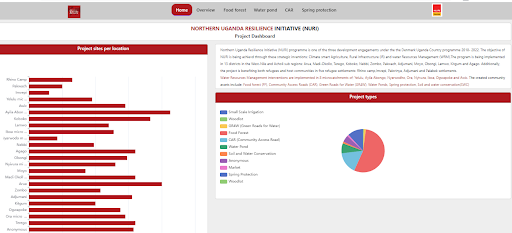
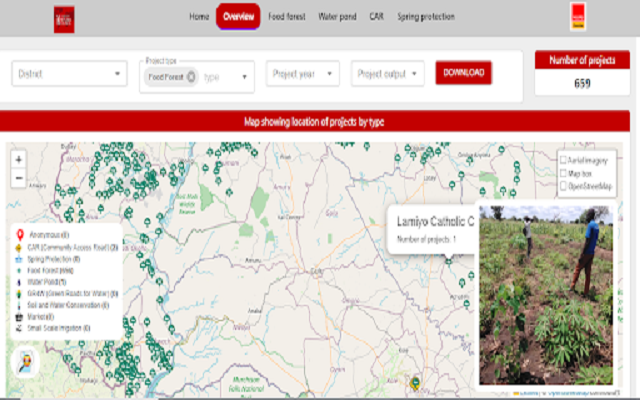
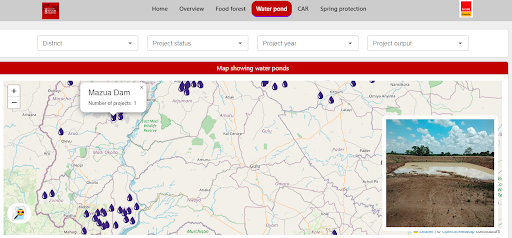
The DRC (Danish Refugee Council) GIS Dashboard is an initiative engineered under Northern Uganda Resilience Initiative (NURI) programme Which is one of the three development engagements under the Denmark Uganda Country programme 2018- 2022.

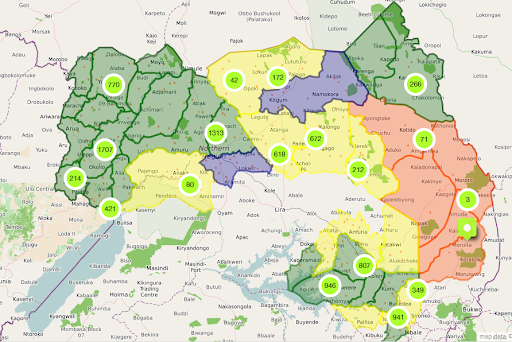
On the program, OpenStreetMap Uganda collaborated with Danish Refugee Council (DRC) to visualize the NURI project with the application of geospatial techniques to produce a web map and an atlas.

The objective of NURI is being achieved through these strategic inventions:

  • Climate smart Agriculture.
  • Rural Infrastructure (IR)
  • Water Resources Management (WRM).
The program was implemented in 13 districts in the West-Nile and Acholi sub regions: Arua, Madi-Okollo, Terego, Koboko, Nebbi, Zombo, Pakwach, Adjumani, Moyo, Obongi, Lamwo, Kitgum and Agago. Additionally, the project is benefiting both refugees and host communities in five refugee settlements:
  • Rhino camp.
  • Imvepi
  • Palorinya
  • Adjumani
  • Palabek settlements.
Water Resources Management interventions were implemented in 8 microcatchments of; Yelulu, Ayila Abongo, Nyarwodho, Ora, Nyivura, Iboa, Ogwapoke and Awic. The created community assets include: Food forest (FF), Community Access Roads (CAR), Green Roads for Water (GR4W), Water Ponds, Spring protection, Soil and water conservation(SWC). Dashboard (WebMap) and Atlas Objective The web map can be utilized in a couple of ways that include:-
  • Addressing the need for fast, easy access to multi-layered GIS data and tools for the purposes of planning and sustainability leveraging the data for the NURI program.
  • Enable stakeholders and the public access to the results of the analyses, particularly outputs from the Rural Infrastructure and Water resources site-matching and suitability analysis.
  • Offer advantages to project managers and donors, district local governments, such as quicker result generation, in depth analysis, convenience, and cost reduction.
  • The WebMap is a promising decision support tool for Rural infrastructure and water resources management planning and management.
The NURI Project Dashboard and Atlas intended to give an overview about projects carried out under the NURI (Northern Uganda Resilience Initiative) program. That is giving details such as the status, which will enable all the stakeholders to engage and understand the impact of the work done on the program.

Uganda Tourism Dashboard

Toolkit for Measuring Trust in Official Statistics

Client:Paris21
Project Period:May 2019 - December 2022
Location:Kampala

Project Description

This toolkit is a product of the review of the literature and a qualitative study about what trust in official statistics means and how it should be measured. The study was undertaken by OpenStreetMap Uganda and Makerere University and was funded by Paris 21.

The meaning of trust in official statistics and how to measure trust in official statistics from the literature is spelled out in chapter one of the report. Chapter two describes the methodology used to collect and analyze data for the qualitative study to generate how trust in official statistics is understood and measured in Uganda. How trust in official statistics is defined and measured in Uganda is explained. Also, in chapter three the tools for measuring trust in official statistics was developed and presented. Summary and recommendations are discussed in chapter four of the report.

Study Objectives

The major objective of this work was to develop a toolkit to measure trust in official statistics and Trust in institutions that produce statistical products. The specific study objectives inlcuded:-

  1. Meaning of trust in official statistics is provided in detail.
  2. Conceptual framework for the trust measurement toolkit.
  3. The perspective of Uganda as a case study.

Tools for Measuring Trust:-
  • Tools for Measuring Trust.
  • Self-administered tools.
  • Feedback mechanisms, a survey among users and institutions.
  • Assessments, audits, and surveillance.
Recommendations

The measurement of trust in official statistics and in institutions producing statistics should be done frequently over a defined period of time.
The strategy should clearly spell out how trust levels will be measured, behaviors and actions to be changed, the resources required, and the time frame.

Lekuru Victoria Mapping a Land parcel in Nebbi District
Data Enumerator mapping a land parel in Nebbi District.
stakeholders participatory mapping activity in Omoro district
Stakeholders participatory mapping activity in Omoro district.
Enumerators Training in Gulu District
Enumerators Training in Gulu District.
Parcels developed by ML and AI for field mapping

COP4GEOGLAM

Client:European Union
Project Period:July 2020 - August 2021
LocationNorthern Uganda - 41 Districts
Link:

Project Description

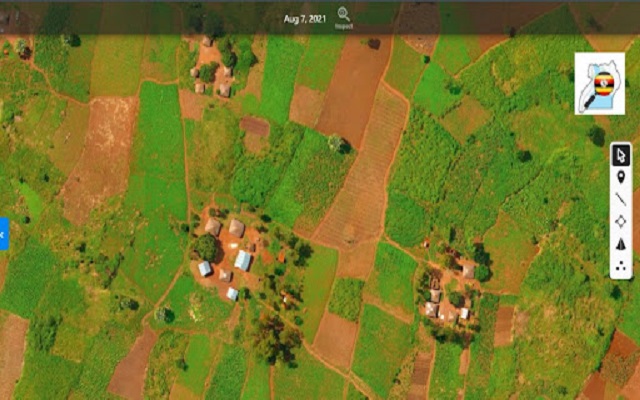
Crop type mapping during the first growing season. To support the ad-hoc baseline of crop monitoring, Uganda being one of the countries selected as a case study ground, OpenStreetMap Uganda was required to make field visits to the selected areas of interest and map crop type and other land uses identified in these parcels.

COP4GEOGLAM Uganda Scope
COP4GEOGLAM Uganda Scope.

The activities were covered in the months of May through to Mid July with a number of obstacles revolving around the pandemic COVID-19. A number of methodologies were deployed to achieve the success of the project.Tools deployed in the field included OpenDataKit, Kobotoolbox Server and excel spreadsheet. Means of transport used included a ferry to cross River Nile, Boda Bodas (Motorcycle), and Cars. Visualization softwares such as QGIS, Umap, and Google Data Studio were utilized to monitor progress and report on the field work.

Field Mapping
GPS reading in field mapping using ODK.
Mapillary Photo Mapping

PhotoMapping New Cities

Donor:Meta (Facebook)
Project Period:March - December 2021
Location:Arua, Mbale, Gulu, Mbarara, Masaka, Fortportal, Lira, Jinja, Soroti, Entebbe Cities
Link Blog

Project Description

Facebook Community Impact Microgrant

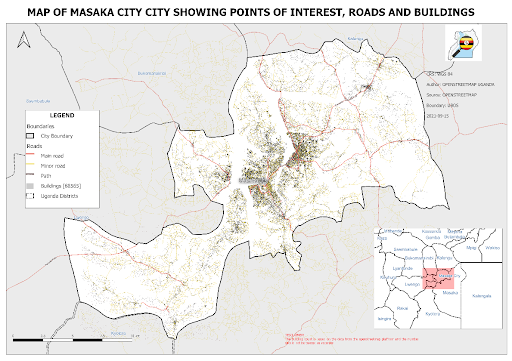
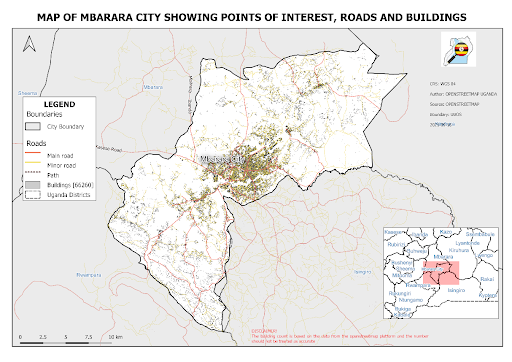
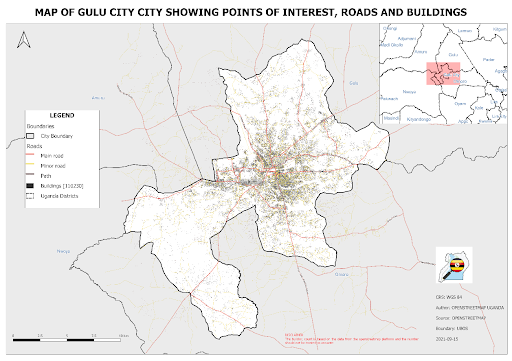
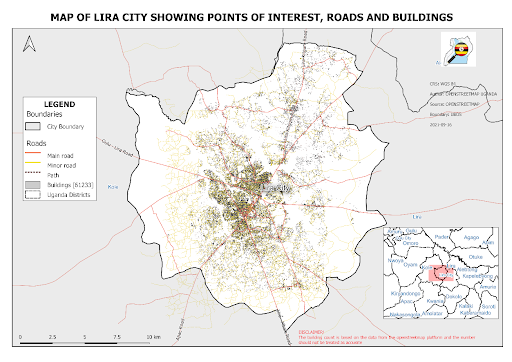
In July 2020, 15 municipalities in Uganda attained city status as a result of the ever-increasing population due to rural-to-urban migration. The new cities lack up-to-date geospatial information, limiting the effective extension and monitoring of services and settlement across these new cities. Information about road conditions, garbage collection, environmental degradation, and adherence to physical plans is not readily available to the city planners.

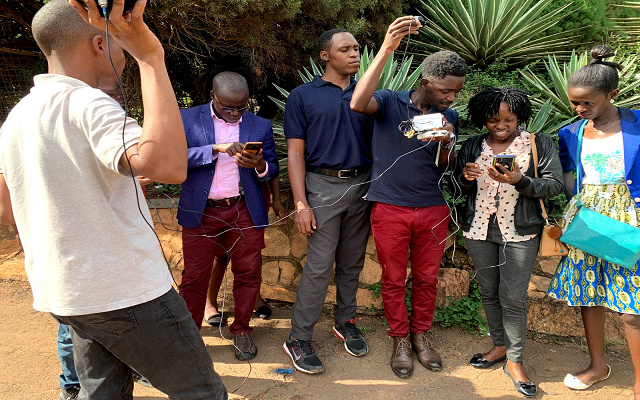
OpenStreetMap Uganda built upon its existing remote mapping efforts in the ongoing “mapping of the new cities initiative” by engaging the YouthMapper chapters and the general OSM community in a nationwide Mapillary campaign to generate over 100,000 new street-level images. These used to add more detailed road information to OpenStreetMap, such as data about street lights, road conditions, building heights, building materials and business information, that will be shared and used by the Ministry of Lands and city authorities to plan and monitor the new cities more effectively.

Community Participatroy mapping in Gulu district
noble farms seed distribution
Noble Farms Uganfa seed distribution enumerators training

Farmer's Seed distribution

Project Period:2020
Location:Gulu District

OpenStreetMapUganda in collaboration with OpenGIS Uganda worked with Noble Farms Uganda Limited, private agricultural training and inputs provider to introduce open mapping GIS tools and technology to improve efficiency in their work.

Noble Farms Uganda Limited provides farmers with inputs that include seeds, agricultural machinery like tractors, and training on post-harvesting. In order to effectively plan and target farmers' needs, Noble Farms with support from OSM Uganda and OpenGIS Uganda embarked on setting up a farmer profile and needs a platform.

The Farmer profile platform is a low-cost GIS platform that allows Noble farms to easily locate and monitor their farmers as well as identify their needs early enough. This allows stock the adequate amounts of seeds and tools for the various agricultural seasons. The farmer profile platform also allows Noble farms to plan for effective delivery, maintenance, and monitoring of the agricultural equipment supplied and hired.

Farmers in remote and rural areas of Uganda face a huge challenge accessing quality seeds and agricultural inputs, the farmer profile platform in many cases eases the identification of farmers and allow easy location and tracking of farmers for noble farms Uganda ltd and other agricultural extension services providers to supply good quality seeds and agricultural inputs, this also in turn helps improve the farmer’s harvests and crop output.

Uganda Tourism Dashboard

Aruu Falls Campsite

Aruu Falls

Baker's Fort Patiko

Mapping Uganda's New Cities

ClientOpenStreetMap Foundation
Project Period2020
2020Arua, Mbale, Gulu, Mbarara, Masaka, Fortportal, Lira, Jinja, Soroti, Entebbe Cities
Linkhttp://examplecomp.com

I learned that we can do anything, but we can't do everything... at least not at the same time. So think of your priorities not in terms of what activities you do, but when you do them. Timing is everything.

Data collection uisng bodabodas in kampala
Data collection uisng bodabodas in Kampala City
Hillary Musundi mapping rubbish bins in Kampala
Map Products sharing with Kampala division offices
map showing  waste collection points in Kampala
Map showing waste collection points in Kampala City

Smart Cities:Clean Streets Kampala

Donor:OpenStreetMap Foundation
Project Period:
Project location:
Link:

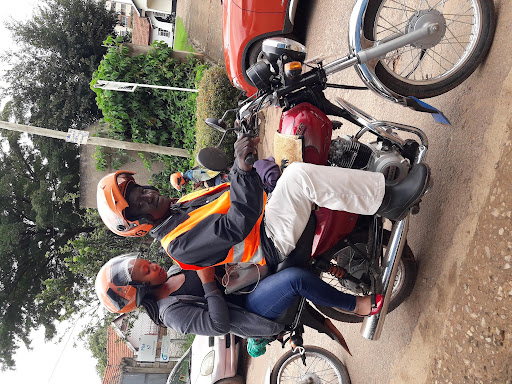
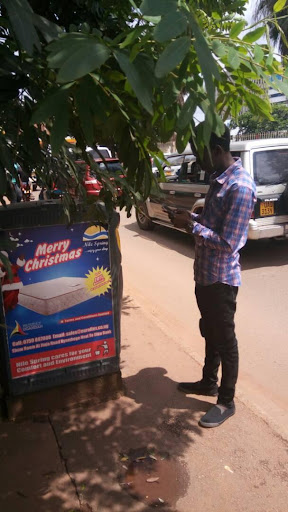
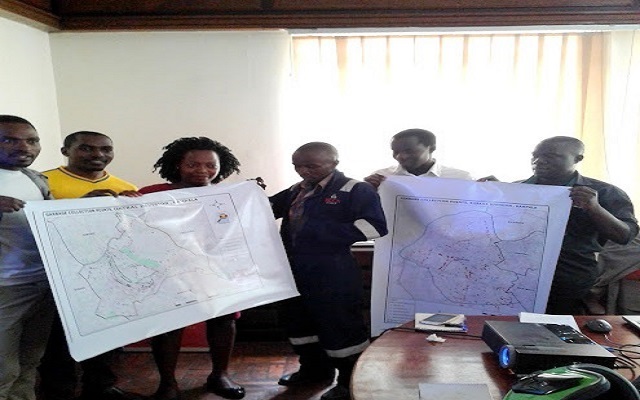
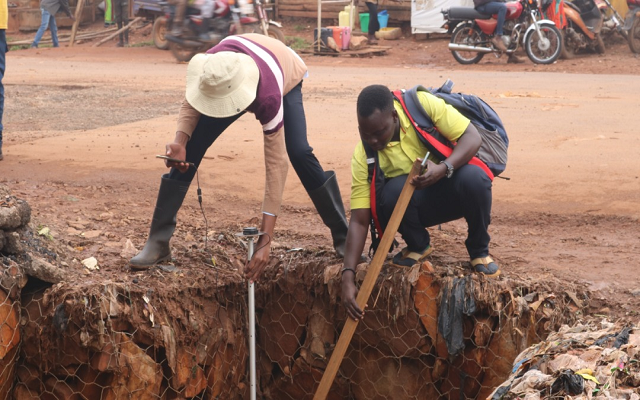
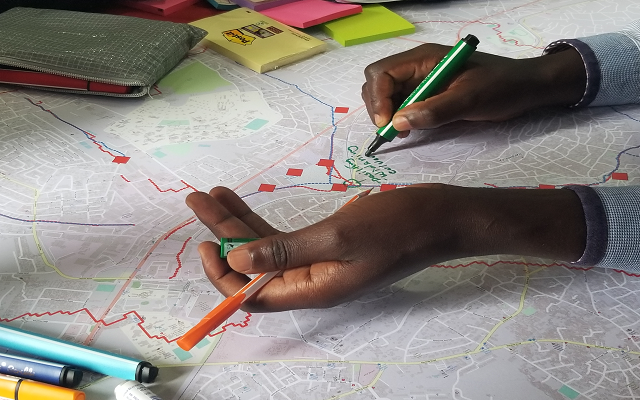
OpenStreetMap Uganda collaborated with Youth Mappers at Makerere University, Bodaboda (Motorcyclists) and Kampala Capital City Authority(KCCA) officials to map out garbage collection points and routes in the city with an aim of using citizen generated data to increase Kampala’s profile as a Smart City.

Rubbish dump in Kampala Slums

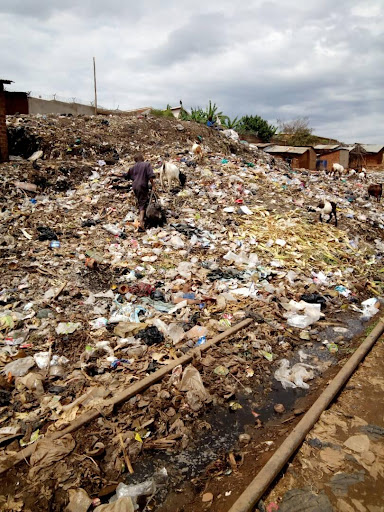
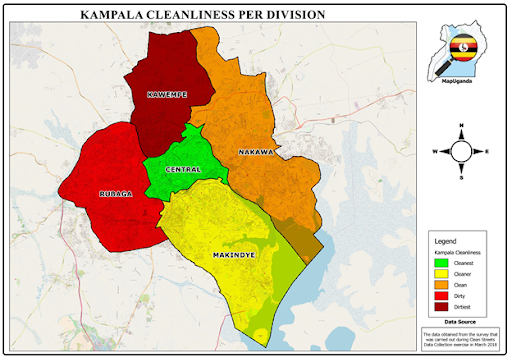
The teams mapped garbage sites across the five divisions that make up Kampala City utilising the open source tools such as Open Data Kit (ODK) and Open Map Kit (OMK), JOSM, to collect and upload data to OpenStreetMap.

Amenity Central Nakawa Makindye Kawempe Rubaga
Recycling 138 6 1 5 2
Waste Basket 19 2 0 2 13
Waste Disposal 178 7 217 3 45
Waste Transfer Station 6 5 0 13 1
Illegal Dumping Sites 83 305 165 408 398

Products Dissemination

  • An online visualization of the data using Umap service.
  • Printed static maps where handed over to the city authorities to help them improve sanitation by tracking where there is illegal dumping and provide infrastructure where there are gaps.
  • Statistics showing the clean divisions depending on the number of illegal dumping sites.
  • Data sharing through different data formats like shapefile, CSV and Geojson
  • Open data available on OpenStreetMap and freely accessed using overpass query
Map showing Kampala divisions based on the cleanest

Project Outcomes

  • KCCA has been able to identify the gaps in waste disposal infrastructure through maps.
  • KCCA to provide infrastructure to areas that have been identified to be having illegal dumping sites and to fight against illegal dumping in areas where the infrastructure exist.
  • Knowledge on the use of mobile data collection techniques, OSM and QGIS has been imparted to the solid waste management staff at KCCA.
  • MapUganda to continue supporting the city authority on solid waste management through repeated mapping.

Next Steps

  • MapUganda would like to continue this work and are open to pathways for funding and partnerships to expand this work in Kampala and to train other cities and sites.
  • MapUganda also proposes engaging private garbage collecting companies in the city and train them on the use of the apps and OSM to identify the gaps in their service delivery.
masaka city map
Masaka City Map
Mbarara City Map
Mbarara City Map
Gulu City Map
Gulu City Map
Lira City Map
Lira City Map
GIS Digital Property  Register Dashboard
GIS Digital Property Register Dashboard
Property details
Property Details
Buildings Dashboard
Buildings Dashboard

Project Period:March 2022 - July 2023
Location:Gulu, Lira, Mbarara and Masaka Cities

Project Desription

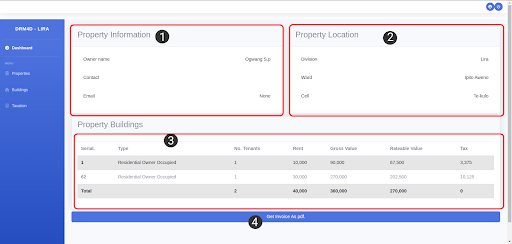
In 2020, the United States Agency for International Development (USAID) initiated the Uganda Domestic Resource Mobilization for Development (DRM4D) activity to support the Government of Uganda fast track and monitor its journey to self-reliance and increase domestic spending on health, education, agriculture, and other public services. The project commenced on January 21, 2020 and is expected to run through January 20, 2025.

The Domestic Revenue Mobilization for Development (DRM4D) Activity is designed to support improvements in revenue mobilization to fast-track Uganda’s journey to self-reliance and increase domestic spending on health, education, agriculture, and other public sector expenditure. The DRM4D Activity will build on previous initiatives in Local Government Revenue improvement by other development partners.

DRM4D, and other development partners came together to support efforts leading to thecomprehensive digitization of revenue processes to enhance data integrity, revenue management, administration, and reporting.

In most cities in the world, property tax represents the highest percentage of the sources of revenue and it is where most of them acquire their revenue for development.
In Uganda however, this hasn't been properly explored hence leading to low anticipated revenue collected. This is always due to:-

  • Expired rolls being used
  • Most of them are actually manual which makes them hard to administer
  • Miss out on new properties that were never captured during the valuation
  • Rolls are almost unusable because of the incomplete data
  • Missing details of the new owners as a result of a change in ownership
  • Properties in the newly extended/annexed areas of the cities had never been assessed for tax as required under the Local Government Rating Act
  • Property valuation rolls were not GIS-enabled, which implies increased costs of revaluations after every five years.
Satelite Imagery of Mbarara City
Knight Frank Uganda Limited (Knight Frank) in association with OpenStreetMap Uganda (OSM Uganda) carried out data collection in four new cities; Mbarara, Masaka, Lira and Gulu in order to provide a GIS enable property valuation system that will be used by the city officials to do valuation with ease and accuracy in order to increase the domestic revenue.

The tools used for data collection were highly automated and makes recording property information much easier and flexible, they can also be used to operate in remote places that have no internet connections. All the raw data was stored on the server and in case of any data losing situation, a backup will be available from this server.

Digitization of Properties
Digitization of Properties using satelite imagery.
Objectives

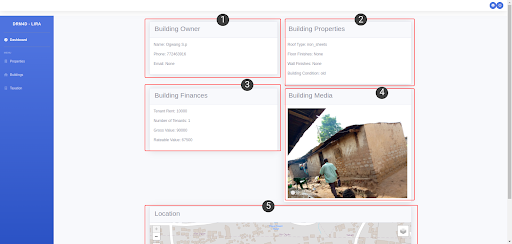
The main objective of this project is to increase revenue from property tax by conducting computerized property valuation with GIS-enabled property valuation rolls. Knight Frank’s goal will be to ensure that the entire assignment is executed in accordance with the client’s requirements as stipulated in the terms of reference, in a timely and cost-effective manner. The specific objectives for the assignment included;-

  • To identify, locate, collect, and capture data on all property as defined under the Local Government Rating Act in cities for purposes of property taxation.
  • To assess rateable values on all property for determination of property tax.
  • To support cities to determine amounts due and payable by property owners before the display of valuation lists.
  • To produce GIS-enabled valuation lists covering all property in the city.
  • To collect, update and digitize business licensing data and update respective registers.
GIS enabled digital property register
Landing page of the GIS enabled digital property register.
Uganda Tourism Dashboard

Aruu Falls Campsite

Aruu Falls

Baker's Fort Patiko

The National Mapping & Survey of Core Primary Teacher’s Colleges, Coordinating Centers and Tutors.

Project Period:January - March 2020
Project Location:Uganda
Link:

OpenStreetMap Uganda in collaboration with Elevate, conducted the national mapping and survey of 23 Core Primary Teacher’s Colleges and 539 Coordinating Centers and Tutors across Uganda.OSM Uganda main objectives for this program included:-

  • Facilitate the national geotagging and surveying of CPTCs and Coordinating Centers through the support of Youth Mappers.
  • Generate the data collected on hard copy and digital maps for use by Elevate, MOES and other partner organizations.
  • Participate in dissemination and policy discussions with Ministry of Education and Sports (MOES) and other partners regarding the mapping process, policy implications, etc.

The features that were mapped on this project included:-

    23 Core Primary Teachers Colleges
  • CPTC Name
  • Geolocation – District, Subcounty, Parish
  • Principal Name & Contact
  • Deputy Principal of Outreach Name & Contact
  • Names of Coordinating Centers under College catchment area
  • Known NGO partners working with the College, CCTs or Schools in the catchment area
    539 Coordinating Centers
  • Coordinating Center Name
  • Geolocation – District, Subcounty, Parish
  • Name of associated primary school (if applicable)
  • Coordinating Center Tutor Name
  • Gender
  • Contact
  • Years as CCT
  • Years at Coordinating Center
  • Has a smartphone?
  • List of private schools under the catchment area
  • Contact
  • Years as CCT
  • List of government-aided schools under the catchment area
  • Known NGO partners working with College, CCT, or Schools in the catchment area
Clean Energy Mapping Project Training of Enumerators on Mobile Data Collection Bidibidi
Enumerators Training on Mobile Data Collection in Bidibidi Refugee Settlement Zone 3
Data Collection Training with Refugees of Bidibidi Refugee Settlement Zone 3
Refugee Enumerators Training on Mobile Data Collection in Bidibidi Refugee Settlement Zone 3
Solar Powered Restaurant in Bidbidi Refugee Settlement

Mapping Energy Saving Solutions

Project Period:February - March 2020
Location:Bidibidi Refugee Settlement | Yumbe District
Link: Report| Blog

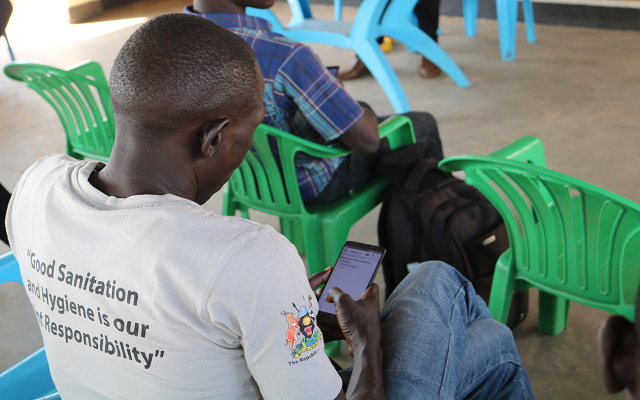
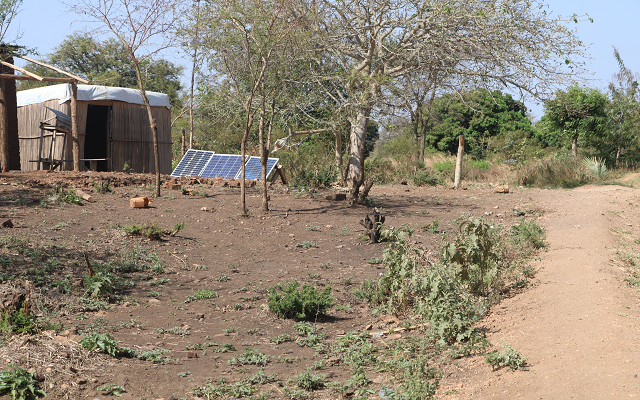
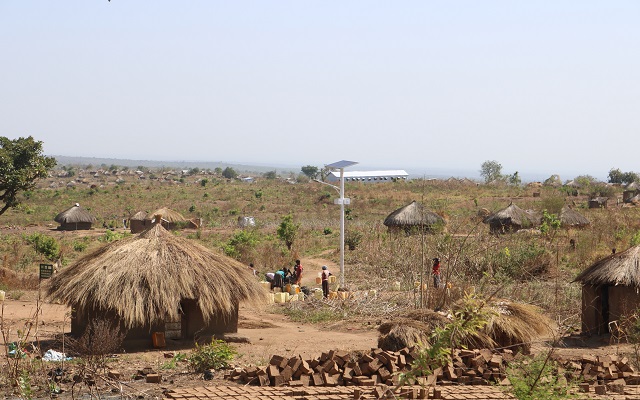
With support from the Response Innovation Lab and Save the Children, HOT and MapUganda carried out a project across Bidibidi Refugee Settlement in northern Uganda to better understand the state of energy-saving solutions available to refugees in the settlement as well as relevant market trends and challenges associated with accessing and purchasing these solutions.

In collaboration with refugees and host community members in Bidibidi, HOT and MapUganda led extensive data collection activities, gathering information from energy-saving solution retailers about where they purchased their products from, what their available stock consisted of, the biggest challenges they faced in selling these products to the refugee and host populations and much more.

Upon completion of the data collection exercise, the information was analyzed and compiled into maps and graphs to support a better understanding of the accessibility and availability associated with purchasing energy-saving solutions in the settlement. Information products and raw data were shared with the AMPERE consortium - a group of implementing partners working to enhance access and adoption of energy-saving solutions across the settlement - to support more targeted efforts in enhancing clean energy product use, linking potential customers with the clean energy market and increasing awareness of such products amongst refugees and respective host community members.

Data Review with Mapping Supervisors and Refugee Data Enumerators
Uganda Tourism Dashboard

Aruu Falls Campsite

Aruu Falls

Baker's Fort Patiko

Mapping Uganda's New Cities

ClientOpenStreetMap Foundation
Project Period2020
2020Arua, Mbale, Gulu, Mbarara, Masaka, Fortportal, Lira, Jinja, Soroti, Entebbe Cities
Linkhttp://examplecomp.com

I learned that we can do anything, but we can't do everything... at least not at the same time. So think of your priorities not in terms of what activities you do, but when you do them. Timing is everything.

a pilot teaching participants about the different parts of a DJI Phantom  4 Pro drone
Asaph, OSM Uganda's drone pilot training on the different parts of a DJI Phantom 4 Pro drone.
Introduction to drones
Fred Mbuya a drone pilot training on introdution to drones.
a pilot demonstrating to the participants the flight maneuvering
Emmanuel Adiba, OSM Uganda's drone pilot demonstrating to participants flight maneuvering.
a Pilot demonstrating how to unpack a drone from its casing and  assembling it
Adriko, OSM Uganda's drone Pilot demonstrating how to unpack a drone from its casing and assembling.

Drone Training and Imagery Analysis:- OPM/UNDP Training

Client:HOT / UNDP
Project Period:April 2019
Project Location:Arua-Imvepi Refugee Settlement

Project Description

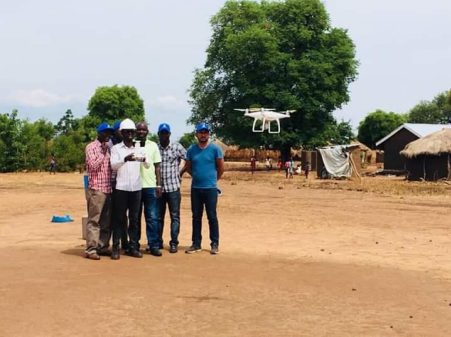
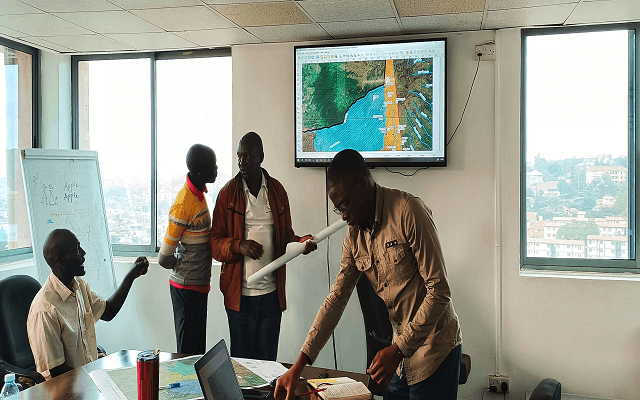
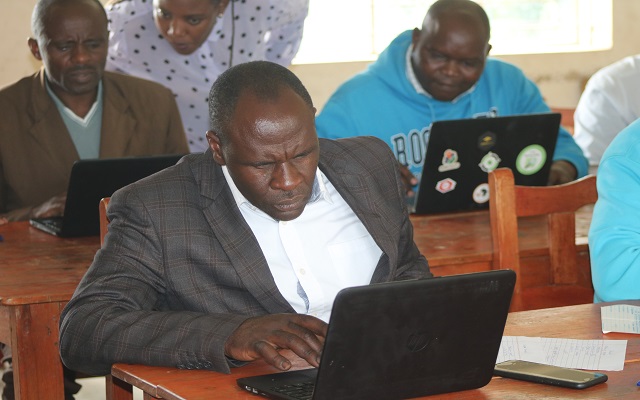
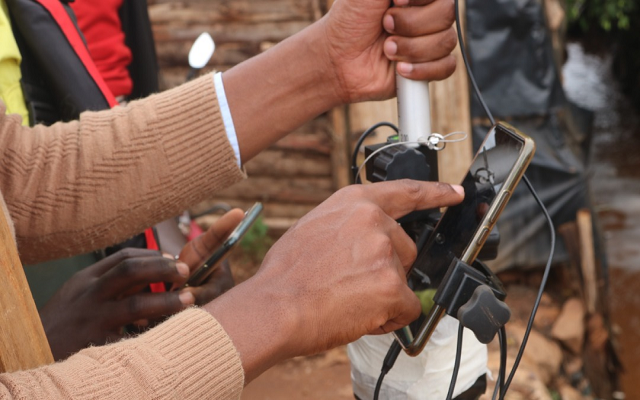
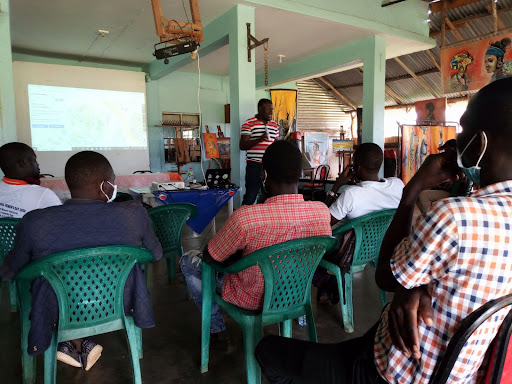
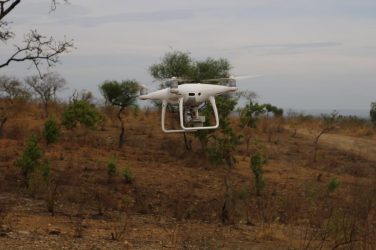
The general objective of the training was to train Office of the Prime Minister (OPM) officers how to fly, capture, process and analyse the images to respond to disaster using drones.

For efficiency OpenStreetMap Uganda (under Uganda flying labs) was exempted from flying at altitude above 400m above the ground.The flights were conducted in accordance with FAA standards and all the flights were carried out below 400 feet.

orthomosaic imvepi refugee settlement
Orthomosaic of Imvepi refugee settlement.
The training covered both the theory and practicals. The training comprised of six modules which covered the following topics;
  • Introduction to drone operations in Uganda.
  • Regulations and Code of Conduct.
  • Meteorology
  • Human factors and Aerodynamics
  • Drone rotary parts and their uses
  • Mission Planning using Pix4D
  • Drone flying for aerial photography.

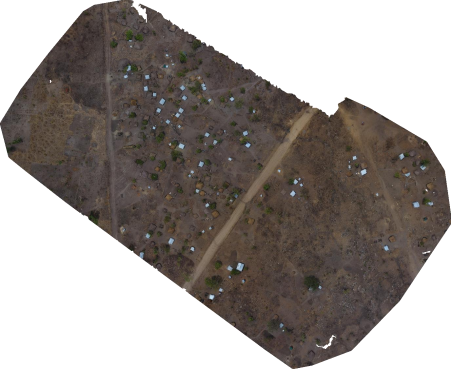
An Area of not more than 10 Sqkm was surveyed in a village identified by UNDP officials. The core purpose was to train participants on how to capture images using drones while carrying out automatic flights.The participants were introduced to drone mission planning using the Pix4D. The drone Pre planning checklists, Meteorology and Aerodynamics were among the topics that were discussed in the theory session. The participants then went for the field drone flying session. Each participant planned for a mission, captured the images of the areas of their missions, with their flight altitude between 70m to 100m above the ground. All the missions were double grid missions and automatic flights so that each participant could capture a regular area of around 250 m by 250 m. This was to ensure that the most appropriate resolution was acquired from the drone survey.

Participants in the field
Participants in the field.

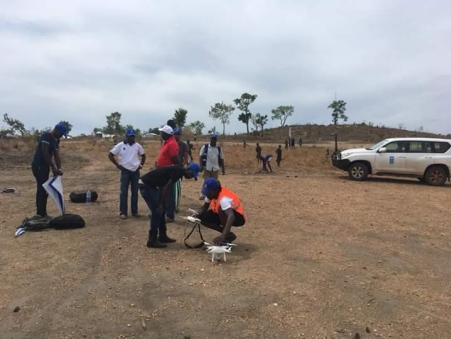
The aerial images were captured at 80% standard overlap. The participants also repeated the session of assembling a drone and disassembling before and after executing the mission plan respectively. The images were then extracted by the pilots and shared with the participants on the day for the image analysis.

In conclusion there exists significant justifications for drone deploy in risk analysis and humanitarian response in each country, although the specific reasons will vary by country and project. From the training, the participants were able to identify that the general drone regulations in the country are still lacking making the use of the technology be at stake. Therefore, more attention must be given to the regulations of drones and must be followed by any pilot. It was widely accepted in the training that there is a strong need for more and better adaptive and diagnostic practice in flying drones for the participants to deploy drones effectively for their humanitarian response. In summary, the training as a whole was a success in a way that all participant’s expectations were met.

Phantom 4 Pro Plus used in the OPM/UNDP Drone training
Uganda's buildings
Border building stats
Josm Mapping
JOSM mapping of roads and buildings
Aruu Falls

Baker's Fort Patiko

Covid-19 Pandemic Response

Project Period:March 2021
Location:-23 Border Districts
Links: Blog |

Timely provision of medical and non-medical supplies is critical for COVID-19 response, and the need to remember the undesirable demands to protect oneself from the disease has prompted the reinvention of risk communication with targeted messaging like the “Tonsemberera (Do not come close to me) campaign.” All over the world, the outbreak prompted the application of tools, such as digital and geospatial technology, for efficient responses, to enable the quick identification and isolation of infected individuals or families while also ensuring the efficient supply of daily needs such as food, especially among those that were gravely affected by the pandemic.

OpenStreetMap is one such platform that enables building tools and obtaining demographics without needing complex techniques. With the identification of buildings, access roads, and amenities, responders gain easy access to information, and so the planning and delivery of support services become more efficient.

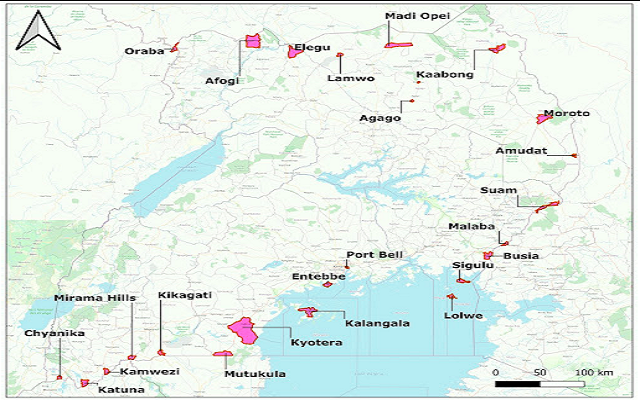
Unfortunately, the most affected areas in Uganda were the border districts that only existed as blank spots on OpenStreetMap. MapUganda, together with Geo YouthMapppers, came forward through the HOT Microgrant program to support the availability of data for the planning and actions of government and field responders, such as the Ugandan Red Cross. The parties embarked on mapping buildings, roads, and identifiable amenities for porous border entry points to help create detailed maps to support and retool the Ugandan Red Cross Society and Ministry of Health surveillance efforts against the spread of the pandemic.

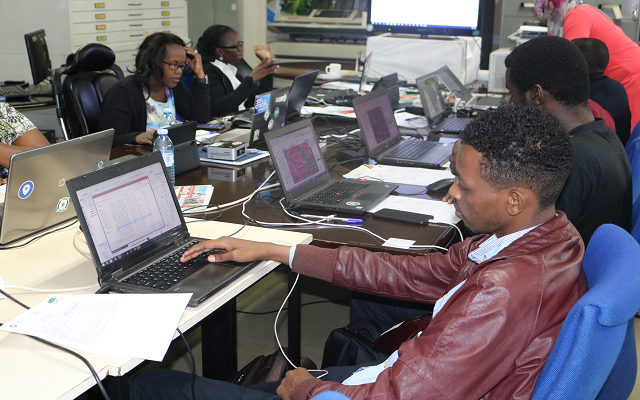
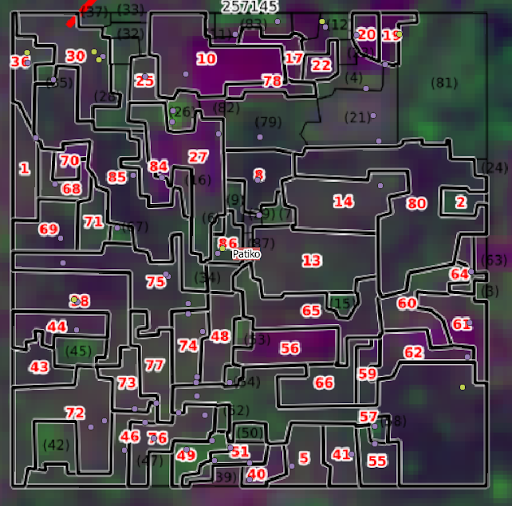
In spite of the lockdown of the airport in March and the strict monitoring and testing at official borders entry points, COVID-19 transmission still found its way into the country through the porous border points, carried by people entering from the neighboring countries of Kenya, Congo, and Tanzania. With support from a Rapid Response Microgrant, students and community members dedicated a piece of their time every day to contribute to the remote mapping of 27 border towns.

Data Collected

A series of trainings and work sessions using different tools, such as JOSM, ID Editor, Tasking Manager, Quantum GIS, Umap platform, were used to remotely prepare the data and information for the communities at the frontline of the awareness and risk communications against the pandemic.

  • More than 250,000 buildings were added to the map
  • Over 7000km of roads were collected.
  • More than 400km of waterways were also mapped in these all the border points.
  • 27 Digital and paper maps were created.

Insights from the mapped border towns

Among all the 27 border towns, Kyotera and Busia had the highest number of buildings. The access roads are primarily distributed across Kyotera, Elegu, Busia, Mutukula, and Moyo border towns, with Kyotera having the highest number of access roads. This attributes to the dense population of the town and puts its population at risk of an outbreak if there is a community infection within the area.

  • Bat-Human Interface Mapping-STOP Spillover Bundibugyo district Uganda

    STOP SpillOver, Uganda

    Mapping human-bat interfaces in Bundibugyo district.

  • Mosopisyek - Benet in Mount Elgon Uganda

    The Mosopisyek (Benet)

    Resolving land conflicts through creating ancestral maps.

  • OpenStreetMap in Schools Uganda

    OpenStreetMap in Schools

    Fostering quality education through geospatial skills.

  • Electricity Demand Estimation in Uganda Agriculture Sector

    Electricity Demand Estimation

    Challenges and Opportunities of Electrifying the Agriculture Sector

  • Uganda Tourism Dashboard

    Mapping Tourist Eco Systems

    Uganda's tourism in Northern Uganda using OpenStreetMap.

  • Floods Mapping in Uganda Kampala

    Flood resilience mapping

    Technical support for the implementation of the GKIFP program.

  • NYTIL Industries Geospatial Mapping

    Manufacturers' Mapping

    Local procurement profiling uisng OpenStreetMap

  • somalia waste management mapping

    Solid Waste Mapping Project

    Remote mapping in support of OSM Somalia

  • Food Forest overview of NURI program

    Geospatial NURI WebMap & Atlas

    Northern Uganda Resilience Initiative Program Overview

  • Domestic Revenue Mobilization for Development

    Domestic Revenue Mobilization for Development (DRM4D)

    Uganda new cities applying OpenStreetMap in property revenue management.

  • Capacity Development Training

    Trust Tool Kit for National Statistics

    Measure of trust in national statistics research in collaboration with Makerere University.

  • Drone Imagery GEOGLAM Uganda

    Crop Mapping for GEOGLAM Country Level Support

    41 districts mapped as part of the Copernicus Global Land component “COPERNICUS4GEOGLAM".

  • PhotoMapping Using Mapillary Uganda

    PhotoMapping New Cities

    Application of Mapillary (META) to improve OpenStreetMap data.

  • noble farms seed distribution

    Farmer's Seed distribution

    Application of opensource tools in improving commercial agriculture

  • A light moment sharing map products from the training

    Open Cities, OpenMapping Ggaba

    GIS capacity growth of KCCA staff and mapping for flood resilience.

  • Map Products sharing with Kampala division offices

    Clean Streets Kampala

    Smart Cities adoptation in Uganda using OpenStreetMap.

  • Map Making in QGIS

    Disaster Capacity Building

    OpenStreetMap application to support smart cities adoptation in Uganda.

  • National Teachers Training

    The National Mapping & Survey

    Geospatial Mapping of Core Primary Teacher’s Colleges, Coordinating Centers and Tutors in Uganda.

  • Solar Powered Security Light at a Water Point in Bidibid Zone 3 Refugee Settlement

    Mapping Energy Saving Solutions

    Open mapping application techniques to support smart cities adoptation in Uganda.

  • a drone pilot inspecting a participant as she installs the propellers of the  drone

    Drone Training & Imagery Processing

    OPM/UNDP Training at Imvempi Refugee Camp

  • covid-19 response mapuganda

    Covid-19 Pandemic Response

    Mapping Ugandan Border Entry Towns

The Lead Team

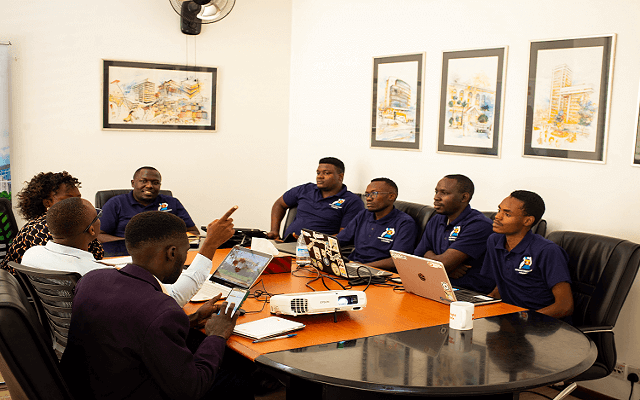
We leverage the experience of the youth with over 40 years combination in different sectors and backgrounds which contribute to our vision and mission as we solve our communities challenges using geospatial opensource technologies.

Allan Mbabani

Allan Mbabani

Executive Director

Allan Mbabani has over 7 years of experience working in the NGO space and geospatial technologies for community development.

Ronald Tumusiime

Ronald Tumusiime

Head of Operations, Programs and Finance

Ronald has over 10 years working in the NGO and financial spaces. Deploying strategic approaches to community development.

Arthur Mukunya Andersen

Mukunya Arthur

Head of Drone Technology


Edwin Kiyimba

Edwin Kiyimba

Head of Innovations and Research

A passionate tech savy, Edwin has over 4 years of software geospatial development.He has led developments in the community using tech and geospatial approaches.

Jemimah Precious Mukisa

Jemimah Precious Mukisa

Head of Community Development and Engagement

Over 7,000 community members to the OpenStreetMap community in a space of 2 years.Jemimah has also a background in quantity surveying from Makerere University.

More of the Team

About Us

OpenStreetMap Uganda (MapUganda) is a registered NGO working across Uganda, promoting community mapping, GIS awareness, actively contributing open datasets, and building a network of enthusiastic community mappers in Uganda. MapUganda contributes its mapping to the OpenStreetMap platform. MapUganda has been operating since 2012 and has worked with international organizations that include the World Bank and Humanitarian OpenStreetMap Team (HOT) to execute data collection, capacity building, and information systems strengthening in Uganda.


Services

  • Disaster Response

  • Geospatial Training

  • Digital Data Collection (Geospatial Research)

  • Geospatial Dataset Generation

Partner WithUs

Are looking at employing sustainable methods to provide impact in your work?
We are here to support you all the way to achieving success with our experienced and determined team ranging from geospatial specilists, engineering, socialist, among other specialities.

What our Partners Say?

"Had a great meeting with OSM Uganda in Kampala, discussing challenges and gaps in mapping I experienced during our Médecins Sans Frontières (MSF) health assessment in Karamoja. I managed to get them hooked on using Mapswipe, that will help them speed up their mapping in future projects and also make community participation more accessible 🙂"

Andries Heyns Andries Heyns Geospatial Consultant - Médecins Sans Frontières (MSF) UK and Ireland

"We have seen another great mapathon happening the past weekend. I just want to really thank you for that!! It is now ready for our MSF teams to use for any of their interventions. For all of our MSF activities in the region we will now have a better view where communities are exactly living."

Jorieke Vyncke Jorieke Vyncke GIS advisor & Missing Maps Project Coordinator - Médecins Sans Frontières (MSF) UK and Ireland

"I want to take this opportunity to thank everyone here contributing anything on the mapping exercise. I work with Ministry of Health but all our coordinates that are accurate are obtained from OpenStreetMap. This is only possible because of your great contribution. I salute you all🙂."

Atuhaire Immaculate Dr. Atuhaire Immaculate Epimideologist - Ministry of Health, Uganda

"Making our communities visible to the global village starts with me mapping my village. Let's make geospatially informed decisions for community developments."

Contact Us

Let's have a discussion over coffee at our offices or schedule an online session.